This small article is intended to instruct you in the creation of one-page reports with Python. They are a kind of document that aims to summarise a given company's performance in a certain set of quality metrics. You can easily send them via an email message as an automation task.

I'll illustrate how can you make use of this small but powerful sort of report through an example about a clothing brand. The company has numerous stores spread across the Brazilian territory. We were asked to deliver a one-page report about the shops' selling performance to their respective managers.
It has been defined that each day of the year the vendors need to pursue the following stats:
Revenue above R$ 1000.00
Sell at least 4 different products
Earn an average ticket of more than R$ 500.00
Data Import
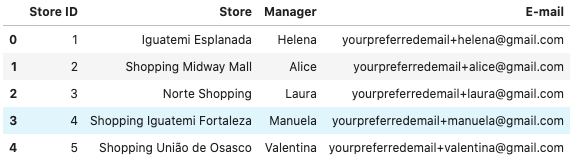
Loading the general pieces of information about the brand's shops and the sellings data.
# The 'stores_date' DF holds the overall stores informations, such as their id and
# the name and e-mail of their manager.
stores_date = pd.read_csv('Database/StoresData.csv')
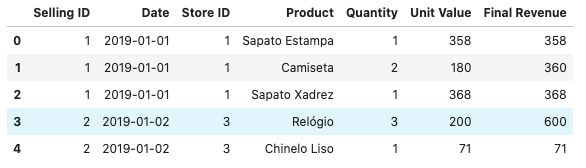
# Now, the 'sellings' DataFrame is storing a record for every individual selling
# made in any of the brand's shops.
sellings = pd.read_excel('Database/Sellings.xlsx')
The 'stores_data' DataFrame:
The 'sellings' DataFrame:
Calculating the Performance Metrics
If you already have some level of experience with pandas, you can readily extract the stats needed with the use of a groupby command.
# Grouping the sellings data accordingly to the date and store.
# 'revenues' have the total revenue obtained by the stores in each day of the year.
revenues = sellings.groupby(['Date','Store ID'])['Final Revenue'].sum()

# 'different_products' stores the number of different products sold.
different_products = sellings.groupby(['Date','Store ID'])['Product'].nunique()

# Extracting the average ticket is going to be a little more difficult. But
# essentially we'll get the average revenue earned for every day of the year.
average_ticket = (sellings.groupby(['Date', 'Store ID' ,'Selling ID'])['Final Revenue'].sum()
 .groupby(['Date', 'Store ID']).mean())
Report Construction
The one-page report to be built is nothing more than an HTML customizable table. It will be placed inside the email's text to be sent to the managers.
The final appearance of the table and its email message is available below:
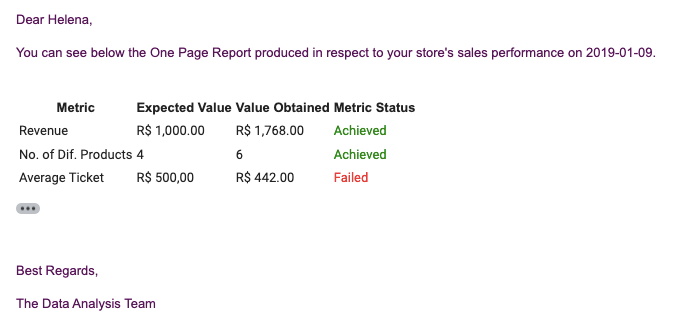
In the first two paragraphs, the manager's name and the date to which the report refers are shown; it is important to maintain our communication as natural as possible.
Regarding the table itself, we only need to use Python's capacity for formatting strings. Note that both "Value Obtained" and "Metric Status" columns are customizable in accordance with the numbers achieved by the shop on the given date.
But before constructing the table structure, we ought to get the values that fill it.
# Importing the necessary modules to the email sending.
import smtplib
from email.message import EmailMessage

# Through this nested loop, we are going to obtain the stores' general informations
# (manager name and e-mail) and their daily performance data.
for store_id in stores['Store ID']:

    # Getting the store's basic informations.
    store_name = stores[stores['Store ID'] == store_id]['Store'].values[0]
    manager = emails[emails['Store'] == store_name]['Manager'].values[0]
    manager_email = emails[emails['Store'] == store_name]['E-mail'].values[0]

    # For each date when a given store has made a selling, the day's
    # total revenue along the number of different products sold and the average ticket
    # will be stored in variables.
    for date in sellings[sellings['Store ID'] == store_id]['Date'].unique():
        revenue = revenues.xs([date, store_id], level=[0,1]).values[0]
        no_different_products = (different_products.xs([date, store_id], level=[0,1])
                                                                     .values[0])
        ticket = average_ticket.xs([date, store_id], level=[0,1]).values[0]
Now that we've made the report's data extraction process, we can finally generate the table.
# Creating the email message. The report will be displayed as an HTML table.
        msg = EmailMessage()
        msg['From'] = 'Write_your_email@gmail.com'
        msg['To'] = manager_email
        msg['Subject'] = f'{pd.to_datetime(date).date()} One Page Report'

        # 'add_alternative' enables us to use HTML structure in the message. Just remember
        # to set the 'subtype' argument to 'html'.
        msg.add_alternative(
            f'''
            <p>Dear {manager},</p>
            <p>You can see below the One Page Report produced in respect to your store\'s sales
            performance on {pd.to_datetime(date).date()}.</p>
            <br>
            <table>
                <tr>
                    <th>
                        Metric
                    </th>
                    <th>
                        Expected Value
                    </th>
                    <th>
                         Value Obtained
                    </th>
                    <th>
                         Metric Status
                    </th>
                </tr>

                <tr>
                    <td>
                        Revenue
                    </td>
                    <td>
                        R$ 1,000.00
                    </td>
                    <td>
                        R$ {revenue :,.2f}
                    </td>
                    <td>
                        <font color={'green' if revenue >=1000 else 'red'}>
                            {'Achieved' if revenue >=1000 else 'Failed'} </font>
                    </td>

                </tr>

                <tr>
                    <td>
                        No. of Diff. Products
                    </td>
                    <td>
                        4
                    </td>
                    <td>
                        {no_different_products}
                    </td>
                    <td>
                        <font color={'green' if no_different_products >=4 else 'red'}>
                            {'Achieved' if no_different_products >=4 else 'Failed'} </font>
                    </td>
                </tr>

                <tr>
                    <td>
                        Average Ticket
                    </td>
                    <td>
                        R$ 500.00
                    </td>
                    <td>
                        R$ {ticket :,.2f}
                    </td>
                    <td>
                        <font color={'green' if ticket >=500 else 'red'}>
                            {'Achieved' if ticket >=500 else 'Failed'} </font>
                    </td>
                </tr>
            </table>
            <br>
            <p>Best Regards,</p>
            <p>The Data Analysis Team</p>
            '''
            ,subtype='html')
In case you have never made an HTML table, the tag represents a row and one of its cells. refers to one of the header's labels.
The logic here is to simply insert the Python's variables inside the HTML text. When it comes to the "Metric Status" column, a one-line conditional statement will handle the job of registering the right message. If the metric's minimum target value has been achieved, the word "Achieved" painted in green is displayed; otherwise, "Failed" in the red font will be shown.
With that stage completed, we can send the individual reports to the managers, knowing that they will receive a simple but informative set of data about their shop's sales performance.
Here is the full code:
# Importing the necessary modules to the email sending.
import smtplib
from email.message import EmailMessage
my_email = 'Write your e-mail address here'
my_password = 'Write your e-mail password here'

# Through this nested loop, we are going to obtain the stores' general informations
# (manager name and e-mail) and their daily performance data.
for store_id in stores['Store ID']:

    # Getting the store's basic informations.
    store_name = stores[stores['Store ID'] == store_id]['Store'].values[0]
    manager = emails[emails['Store'] == store_name]['Manager'].values[0]
    manager_email = emails[emails['Store'] == store_name]['E-mail'].values[0]

    # For each date when a given store has made a selling, the day's
    # total revenue along the number of different products sold and the average ticket
    # will be stored in variables.
    for date in sellings[sellings['Store ID'] == store_id]['Date'].unique():
        revenue = revenues.xs([date, store_id], level=[0,1]).values[0]
        no_different_products = (different_products.xs([date, store_id], level=[0,1])
                                                                     .values[0])
        ticket = average_ticket.xs([date, store_id], level=[0,1]).values[0]

        # Creating the email message. The report will be displayed as an HTML table.
        msg = EmailMessage()
        msg['From'] = 'Write_your_email@gmail.com'
        msg['To'] = manager_email
        msg['Subject'] = f'{pd.to_datetime(date).date()} One Page Report'

        # 'add_alternative' enables us to use HTML structure in the message. Just remember
        # to set the 'subtype' argument to 'html'.
        msg.add_alternative(
            f'''
            <p>Dear {manager},</p>
            <p>You can see below the One Page Report produced in respect to your store\'s sales
            performance on {pd.to_datetime(date).date()}.</p>
            <br>
            <table>
                <tr>
                    <th>
                        Metric
                    </th>
                    <th>
                        Expected Value
                    </th>
                    <th>
                         Value Obtained
                    </th>
                    <th>
                         Metric Status
                    </th>
                </tr>

                <tr>
                    <td>
                        Revenue
                    </td>
                    <td>
                        R$ 1,000.00
                    </td>
                    <td>
                        R$ {revenue :,.2f}
                    </td>
                    <td>
                        <font color={'green' if revenue >=1000 else 'red'}>
                            {'Achieved' if revenue >=1000 else 'Failed'} </font>
                    </td>

                </tr>

                <tr>
                    <td>
                        No. of Diff. Products
                    </td>
                    <td>
                        4
                    </td>
                    <td>
                        {no_different_products}
                    </td>
                    <td>
                        <font color={'green' if no_different_products >=4 else 'red'}>
                            {'Achieved' if no_different_products >=4 else 'Failed'} </font>
                    </td>
                </tr>

                <tr>
                    <td>
                        Average Ticket
                    </td>
                    <td>
                        R$ 500.00
                    </td>
                    <td>
                        R$ {ticket :,.2f}
                    </td>
                    <td>
                        <font color={'green' if ticket >=500 else 'red'}>
                            {'Achieved' if ticket >=500 else 'Failed'} </font>
                    </td>
                </tr>
            </table>
            <br>
            <p>Best Regards,</p>
            <p>The Data Analysis Team</p>
            '''
            ,subtype='html')

        # Logging into our email account to send the emails.
        with smtplib.SMTP_SSL('smtp.gmail.com', 465) as smtp:
            smtp.login(my_email, my_password)
            smtp.send_message(msg)
Conclusion
With that, we've ended this small tutorial. I decided to write this article looking to provide you with an example of how one-page reports can be built in Python. I hope you can exploit the tools and strategies we engendered in order to create your own versions of these documents in your working environment.
Please, follow me on GitHub and LinkedIn; I am actively developing new programming projects with the use of Python.
Comments
Loading comments…