This actually took me quite a bit of googling some time back before figuring this out. Hopefully, this article can make it easier for you — nobody wants to spend too much time Googling for some cosmetic issues. (And I’ll probably forget how to do this a couple of months later so I’m partly writing this article for myself too).
What We Want to Achieve
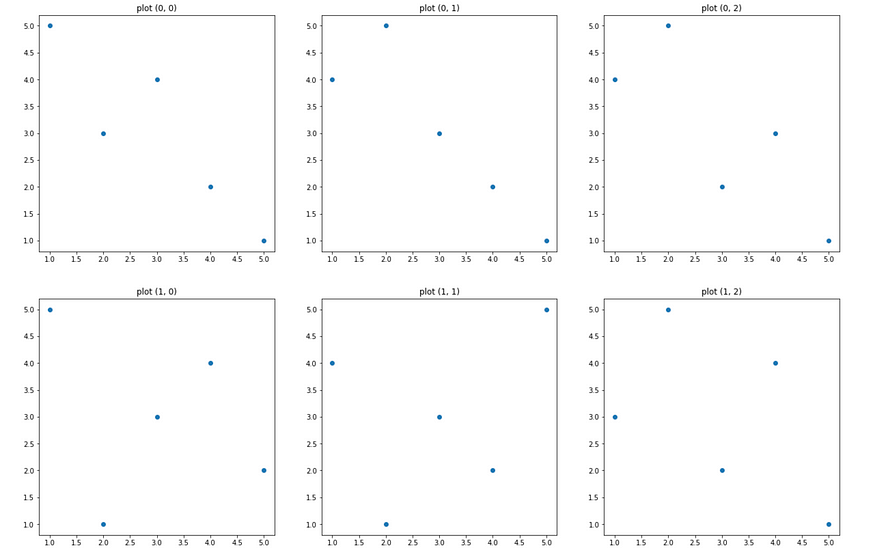
Essentially, we want to plot multiple graphs in rows and columns like this. The plots above are placeholder scatterplots and can be replaced with any other plots eg. lineplots, boxplots, histograms, etc.
The Code to Plot Multiple Graphs (Hard Coded)
# creating subplots with 2 rows, 3 columns
# remember to set the size of your plot using figsize
fig, ax = plt.subplots(2, 3, figsize=(21,14))# plot at row 0, column 0
ax[0, 0].scatter([1,2,3,4,5], [5,3,4,2,1])
ax[0, 0].set_title("plot (0, 0)")# plot at row 0, column 1
ax[0, 1].scatter([1,2,3,4,5], [4,5,3,2,1])
ax[0, 1].set_title("plot (0, 1)")# plot at row 0, column 2
ax[0, 2].scatter([1,2,3,4,5], [4,5,2,3,1])
ax[0, 2].set_title("plot (0, 2)")# plot at row 1, column 0
ax[1, 0].scatter([1,2,3,4,5], [5,1,3,4,2])
ax[1, 0].set_title("plot (1, 0)")# plot at row 1, column 1
ax[1, 1].scatter([1,2,3,4,5], [4,1,3,2,5])
ax[1, 1].set_title("plot (1, 1)")# plot at row 1, column 2
ax[1, 2].scatter([1,2,3,4,5], [3,5,2,4,1])
ax[1, 2].set_title("plot (1, 2)")plt.show()
The Code To Plot Multiple Graphs
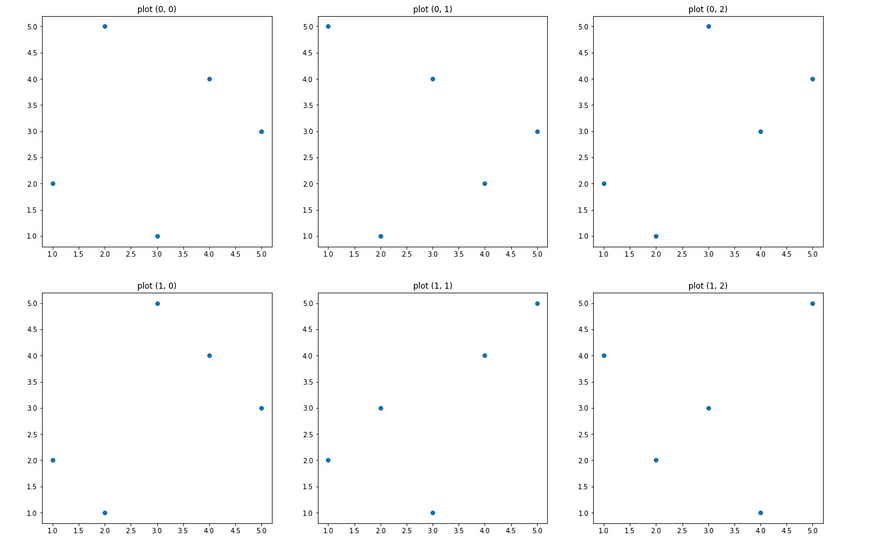
Ideally, we don’t want to hard-code, so here’s how we can do the same thing above using a for loop.
import randomfig, ax = plt.subplots(2, 3, figsize=(21,14))row = 0
col = 0
for _ in range(6):

    x = [1,2,3,4,5] ax[row, col].scatter(x, random.sample(x, 5))
    ax[row, col].set_title(f"plot ({row}, {col})")

    col += 1
    if col > 2:
        row += 1
        col = 0
Example Use Case
Let’s say we have a dataset containing test scores of some students as well as their height (5 rows for simplicity):
import pandas as pddata = pd.DataFrame([
    [67, 87, 85, 78, 57, 58, 1.82],
    [78, 64, 61, 75, 79, 68, 1.64],
    [92, 77, 79, 83, 89, 88, 1.72],
    [65, 52, 43, 67, 51, 54, 1.83],
    [87, 85, 78, 57, 58, 67, 1.78],
],
columns=["english", "math", "physics", "chemistry", "biology", "history", "height"])
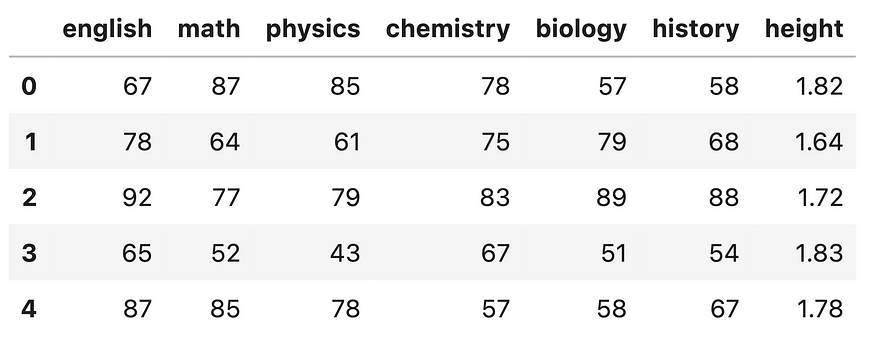
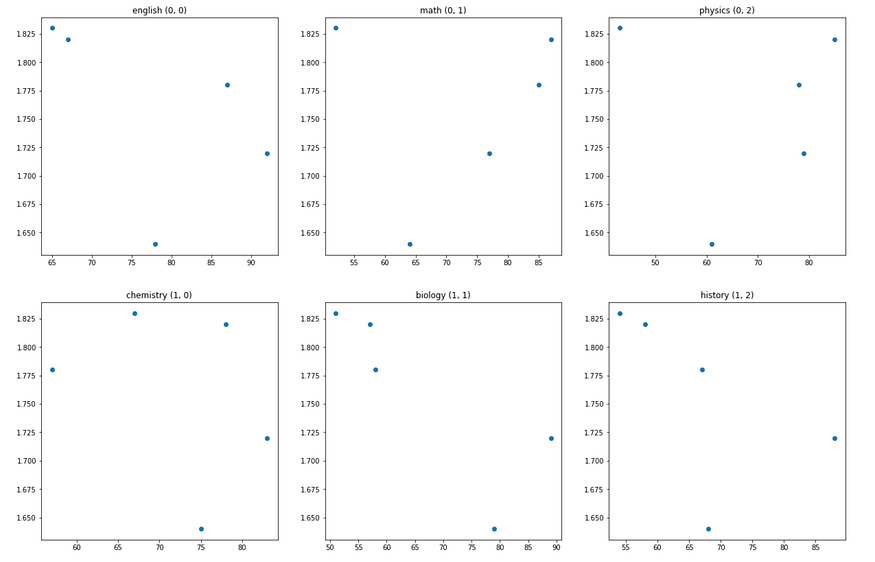
And we wish to plot a scatterplot of each subject score against the height of each student. We can do this using a for loop:
fig, ax = plt.subplots(2, 3, figsize=(21,14))testscores = data.iloc[:, :-1]
height = data["height"]row = 0
col = 0
for subject in testscores.columns: xval = testscores[subject]

    ax[row, col].scatter(xval, height)
    ax[row, col].set_title(f"{subject} ({row}, {col})")

    col += 1
    if col > 2:
        row += 1
        col = 0
Comments
Loading comments…