Sometimes, one legend is not enough.
To create a graph in Python with two legends, you can use the matplotlib library and the legend() function. Here is a basic example of how you could do this:
import matplotlib.pyplot as plt

# Set the x and y data for the two lines
x = [1, 2, 3, 4]
y1 = [1, 4, 9, 16]
y2 = [2, 8, 18, 32]

# Create the figure and axis
fig, ax = plt.subplots()

# Plot the first line
line1, = ax.plot(x, y1, label='Line 1')

# Plot the second line
line2, = ax.plot(x, y2, label='Line 2')

# Create the first legend
legend1 = ax.legend(handles=[line1], loc='upper left')

# Add the first legend to the axis
ax.add_artist(legend1)

# Create the second legend
legend2 = ax.legend(handles=[line2], loc='upper right')

# Add the second legend to the axis
ax.add_artist(legend2)

# Show the plot
plt.show()
Sample Graph Created Using Python:
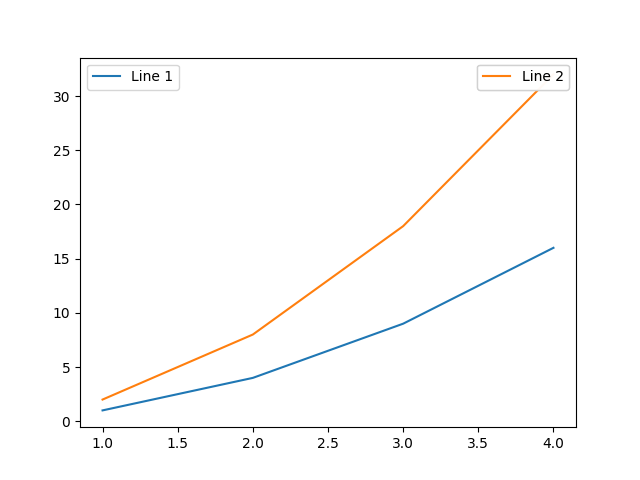
This code will create a figure with two lines, each with its own legend. The first legend will be located in the upper left corner of the plot and will contain the label for the first line. The second legend will be located in the upper right corner of the plot and will contain the label for the second line.
You can customize the appearance and content of the legends by setting various options, such as the font size, title, and location. You can also add additional items to the legends, such as markers or text, using the legend() function or the matplotlib library.
Here is how you can continue the example code I provided in my previous response to customize the appearance and content of the two legends:
import matplotlib.pyplot as plt

# Set the x and y data for the two lines
x = [1, 2, 3, 4]
y1 = [1, 4, 9, 16]
y2 = [2, 8, 18, 32]

# Create the figure and axis
fig, ax = plt.subplots()

# Plot the first line
line1, = ax.plot(x, y1, label='Line 1')

# Plot the second line
line2, = ax.plot(x, y2, label='Line 2')

# Create the first legend
legend1 = ax.legend(handles=[line1], loc='upper left', title='Legend 1', fontsize='small')

# Add the first legend to the axis
ax.add_artist(legend1)

# Create the second legend
legend2 = ax.legend(handles=[line2], loc='upper right', title='Legend 2', fontsize='small')

# Add the second legend to the axis
ax.add_artist(legend2)

# Set the title and axis labels
ax.set_title('Two Legends')
ax.set_xlabel('X values')
ax.set_ylabel('Y values')

# Show the plot
plt.show()
Sample Graph Created Using Python:
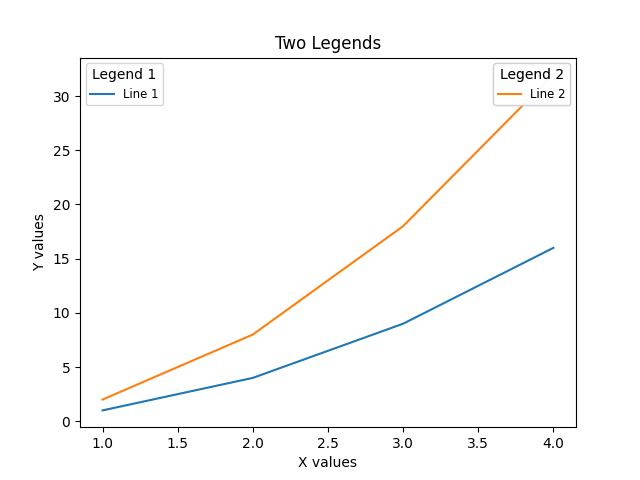
This code will create a figure with two lines and two legends that are located in the upper left and upper right corners of the plot, respectively. The first legend will have the title “Legend 1” and a small font size, and will contain the label for the first line. The second legend will have the title “Legend 2” and a small font size, and will contain the label for the second line. The plot will also have a title and axis labels.
You can customize the appearance and content of the legends further by setting additional options and adding additional items. For example, you could change the color of the legend text or markers, or you could add a marker to the legend entries. You can also use the matplotlib library to customize the appearance of the figure and axis, such as the background color, tick marks, and grid lines.
Comments
Loading comments…