In this article, I will demonstrate how to visualize point clouds in Python using the three most common strategies: 1. Visualize as a point cloud 2. Visualize as a voxel 3. Visualize as a mesh 4. Visualize in a web viewer
I will be using the plotting util function in the ellipsis module for Python. These util functions provide me with some easy one-liners to plot my data.
Ensure to have ellipsis≥3.1.26 installed, older versions don’t have point cloud support built in.
Loading the data
As a start, I will load a piece of my example point cloud. This point cloud is publicly hosted, so the reader can reproduce all the code in the article.
My first step is to load my point cloud from my Ellipsis Drive as a pandas data frame:
import ellipsis as el
#ids for my point cloud
pathId = ''fe5cb352-ccda-470b-bb66-12631c028def''
timestampId = ''7dd94eac-f145-4a8a-b92d-0a22a289fe21''

#extent to grab my area of interest
extent = {    ''xMin'':5.7908,''xMax'':5.79116,''yMin'':51.93303,''yMax'':51.93321}
epsg = 4326

#with the fetchPoints function I can retrieve all points within my extent
df = el.path.pointCloud.timestamp.fetchPoints(pathId = pathId, timestampId = timestampId, extent = extent,  epsg = epsg)

print(df)
As expected, I will find a data frame containing the coordinates of my points in the x, y and z column. As well as the color of each of these points in the red, green, and blue columns:
                 x             y     z  red  green  blue
0     644615.105549  6.788065e+06  7.99   58     73    43
1     644631.144327  6.788061e+06  8.13   57     66    41
2     644614.607203  6.788065e+06  7.98   55     76    43
3     644616.151071  6.788058e+06  7.98   66     74    46
4     644614.472959  6.788053e+06  7.91   94     97    64
The x and y coordinates are in Mercator coordinates and the z is in meters. I retrieved around half a million points. As far as point clouds go, this is actually not that much. Point clouds can easily go up to multiple billions of points.
Plotting the data as points
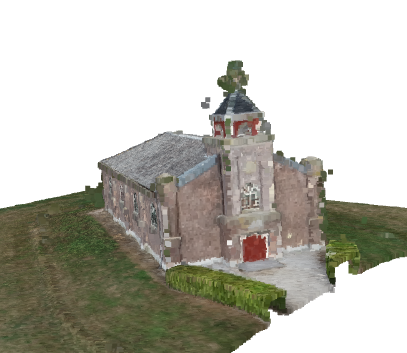
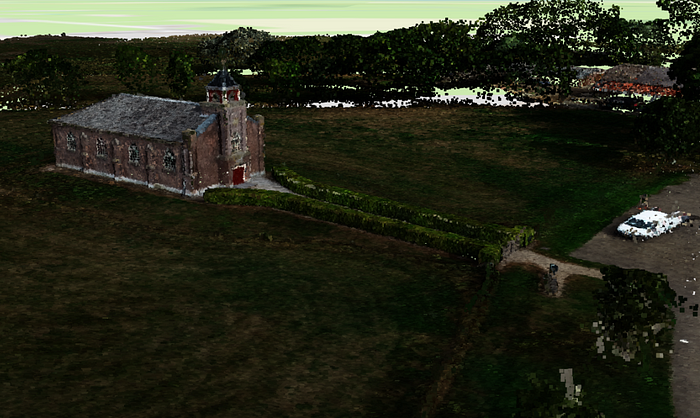
The first thing I can do, is simply plot my data as a point cloud. That is to say a; visualization in which each point is visualized as a small square with a color.
I can use the plotPointCloud function in the utils to create such an interactive visualization.
el.util.plotPointCloud(df, method = ''cloud'')
As a result I get a nice plot of an old church:
Plotting the data as voxel
A voxel is a 3 dimensional grid of cells. Each cell is assigned a color (can be transparent as well). The plotting function will take the mean color of all points within the cell and assigns that color to the cell.
This way of visualizing can cut down the number of points and prevents holes in your visualization.
el.util.plotPointCloud(df, method = ''voxel'')
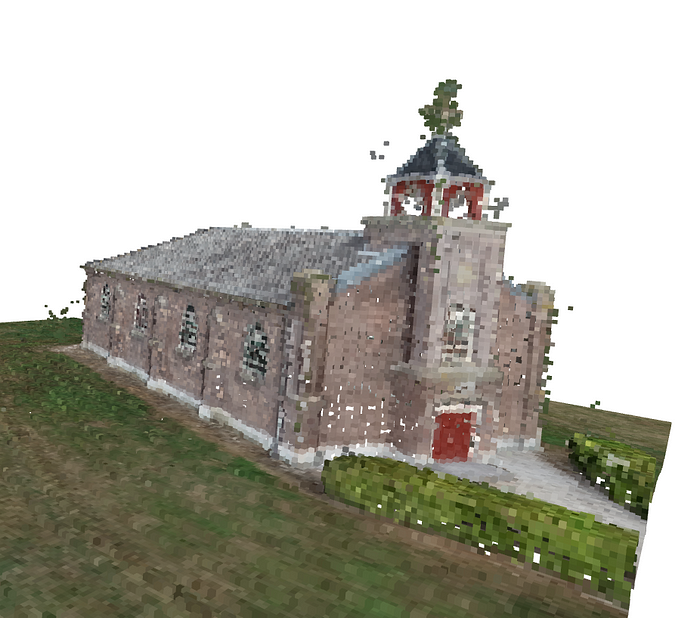
As you can see, the visualization has very similar quality, but is a lot lighter to render. Using the scale parameter of the function you can increase or decrease the number of cells you wish to use.
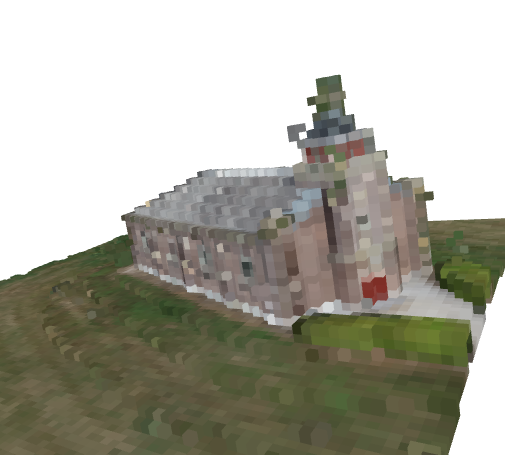
For example using scale 0.01
el.util.plotPointCloud(df, method = ''voxel'', scale = 0.01)
yields a visual that is a lot more coarse.
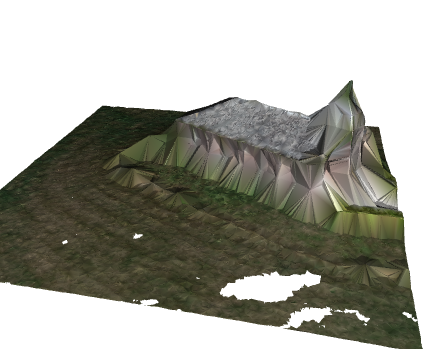
Plotting the data as a mesh
The last, and most difficult, strategy is to create a mesh out of my point cloud. This means that the function will connect nearby points to create triangles. Transforming your point cloud to a mesh can greatly reduce the size of your point cloud, because it is able to summarize a flat plane of many points to just a single triangle.
el.util.plotPointCloud(df, method = ''mesh'', scale = 0.06)
Advanced usage
The ellipsis package simply uses the open3d module to grant the user one easy-to-use high level function. But by using open3d directly you can get access to the exact vertices and faces of, for example, the meshes themselves.
Publishing point clouds to the web
Plotting point clouds locally has one major disadvantage. The first is that you can only plot a limited number of points. There is to my knowledge no easy to use dynamic plotting in which based on the view port points are loaded or off loaded. This puts serious constraints on the size of the point cloud you can plot. The point cloud within this article actually comprises a way larger region than just this single church, but my PC is simply not strong enough to render all points.
To counter this you can consider storing your point cloud as a las file and place that las file into a point cloud viewer. A point cloud viewer will be able to dynamically read your file(s) and therefore give renderings of arbitrarily large point clouds and regions.
The first step would be to save your data as a las file. For this, I will be using laspy.
import laspy
path_file = ''myFile.las''

las = laspy.create(point_format=2, file_version=''1.2'')
las.x = df[''x''].values
las.y = df[''y''].values
las.z = df[''z''].values
las.red = df[''red''].values
las.green = df[''green''].values
las.blue = df[''blue''].values

las.write(path_file)
The last step will be to create a point cloud layer in Ellipsis Drive and upload the file to this layer.
import ellipsis as el

token = el.account.logIn("username", "password")

layerId = el.path.pointCloud.add( "some name", token)[''id'']
timestampId = el.path.pointCloud.timestamp.add(layerId, token)[''id'']
el.path.pointCloud.timestamp.file.add(pathId =layerId, timestampId=timestampId, filePath= pathToYourLocalFile, token=token)
#don''t forget to activate the timestamp once upload is completed
el.path.pointCloud.timestamp.activate(layerId, timestampId, token)
You will then be able to see your point cloud at
`https://app.ellipsis-drive.com/view?pathId={YOUR LAYER ID}`
This gives you a good and interactive view of the church and its surroundings
Conclusion
Though point clouds are not a common data format within Python there is quite some plotting functionality to display point clouds. In case of larger point clouds, or point clouds that you wish to display to an audience publishing your point cloud to the web using Ellipsis Drive can be valuable.
Comments
Loading comments…