
In the age of data-driven investing, it is necessary to have access to quality data, luckily we can do that by simply using python and Binance.
There are two options to do this:
-
use a python package called python-binance
-
Use the python requests library to get data from binance
If you don’t have an account you can register here to get a 10% fee discount https://accounts.binance.com/en/register?ref=WUN0PLU5
- Let’s go over the first option: Python Binance
First, we will install Python Binance with pip: https://github.com/sammchardy/python-binance
Let’s import all the necessary libraries and initialize the client
import pandas as pd
from binance.client import Client
import datetime as dt

# client configuration
api_key = 'API HERE'
api_secret = 'SECRET API HERE'
client = Client(api_key, api_secret)
Now we will select the symbol name(uppercase) and the time interval. Next we will pass the data that we got into a pandas DataFrame and call it data. In this step the index and columns name will be formatted. Finally, we will save the df into a CSV with “data.to_csv(‘filename’)” and plot the data to see what we got!
symbol = "DOTUSDT"
interval=’15m’

Client.KLINE_INTERVAL_15MINUTE

klines = client.get_historical_klines(symbol, interval, "1 Jan,2021")

data = pd.DataFrame(klines)
 # create colums name
data.columns = ['open_time','open', 'high', 'low', 'close', 'volume','close_time', 'qav','num_trades','taker_base_vol',taker_quote_vol', 'ignore']

# change the timestamp
data.index = [dt.datetime.fromtimestamp(x/1000.0) for x in data.close_time]

data.to_csv(symbol+'.csv', index = None, header=True)

#convert data to float and plot

df=df.astype(float)
df["close"].plot(title = 'DOTUSDT', legend = 'close')
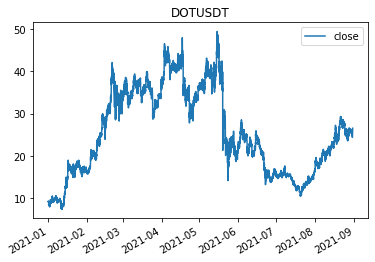
PLOT FOR DOTUSDT
- PYTHON REQUESTS
Let’s import all the libraries needed
import requests
import json
import pandas as pd
import datetime as dt
We will initialize the symbol that we want to retrieve data for, the interval, the start and end dates. These parameters can be found on the official Binance API docs at: https://binancedocs.github.io/apidocs/spot/en/#change-log
url = 'https://api.binance.com/api/v3/klines'
symbol = 'ADAUSDT'
interval = '1h'
start = str(int(dt.datetime(2021,5,1).timestamp()*1000))
end = str(int(dt.datetime(2021,8,1).timestamp()*1000))

par = {'symbol': symbol, 'interval': interval, 'startTime': start, 'endTime': end}

data = pd.DataFrame(json.loads(requests.get(url, params= par).text))

#format columns name

data.columns = ['datetime', 'open', 'high', 'low', 'close', 'volume','close_time', 'qav', 'num_trades','taker_base_vol', 'taker_quote_vol', 'ignore']

data.index = [dt.datetime.fromtimestamp(x/1000.0) for x in data.datetime]

data=data.astype(float)
Let’s show the first rows of the datafram with data.head()
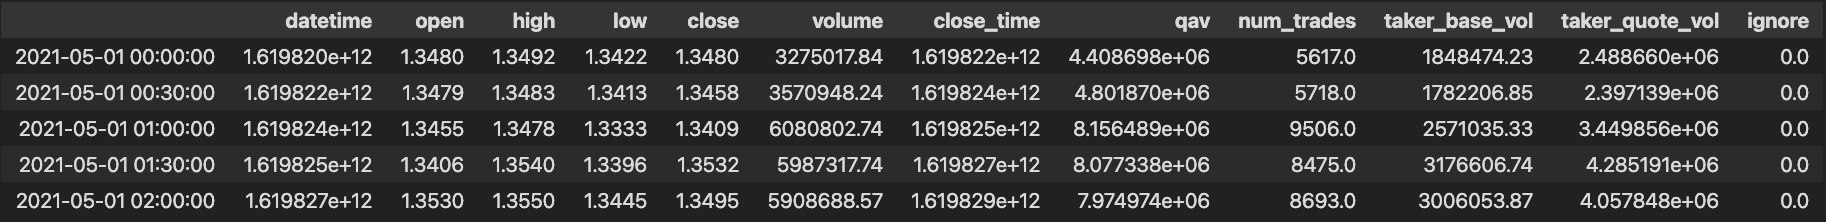
data.head()
Comments
Loading comments…