
AWS CloudWatch is Amazon's monitoring and observability service for AWS resources and applications. It collects logs, tracks metrics, triggers alarms, and surfaces dashboards so you can answer two questions quickly: Is something broken right now? and What changed before it broke?
If you run workloads on EC2, Lambda, ECS, RDS, or API Gateway, CloudWatch is already in the background collecting data—you pay for what you store, customize, and alarm on.
The three pillars you will actually use
CloudWatch bundles several products. Most day-to-day work falls into three areas:
Metrics
Time-series measurements such as CPU utilization, Lambda invocations, SQS queue depth, or custom business counters. AWS services publish standard metrics automatically. You can publish custom metrics with the PutMetricData API or embedded metric format in logs.
Metrics are namespace-scoped (for example AWS/EC2, AWS/Lambda, MyApp/Checkout).
Logs
Centralized log storage via Log groups and Log streams. Applications write here through the CloudWatch Logs agent, the unified CloudWatch agent, or direct API calls. Logs Insights lets you query with a SQL-like language across streams.
Alarms
Rules that watch a metric (or composite expression) and trigger actions when a threshold is breached for a defined number of periods. Actions can notify an SNS topic, run an Auto Scaling policy, or invoke a Lambda function for remediation.
Dashboards tie metrics and alarms into a single view. They do not replace alerting—they help humans investigate faster.
How CloudWatch fits into a typical AWS stack
Application → writes logs → CloudWatch Logs
           → emits metrics → CloudWatch Metrics
CloudWatch Alarm → SNS → email/Slack/PagerDuty
                  → Lambda → auto-remediation
For EC2 instances, install the CloudWatch agent to ship system metrics (disk, memory) and application logs. Lambda functions automatically send execution logs to a log group named /aws/lambda/<function-name>.
RDS publishes metrics like DatabaseConnections, FreeStorageSpace, and ReadLatency. API Gateway exposes 4XXError, 5XXError, and latency metrics.
Setting up your first useful alarm
Example: alert when an Application Load Balancer's 5xx rate stays elevated.
- Open CloudWatch → Alarms → Create alarm.
- Select metric:
AWS/ApplicationELB→HTTPCode_Target_5XX_Count. - Statistic: Sum over 1-minute periods.
- Condition: Greater than threshold (e.g., 10) for 3 consecutive periods.
- Action: SNS topic subscribed to your on-call channel.
Avoid alarm fatigue:
- Use anomaly detection alarms for metrics with seasonal patterns (traffic spikes every morning).
- Prefer composite alarms to reduce noise (CPU high AND error rate high, not either alone).
- Document runbooks linked from the alarm notification.
CloudWatch Logs Insights in practice
When an incident starts, you need ad-hoc queries—not pre-built dashboards. Logs Insights examples:
Find errors in the last hour:
fields @timestamp, @message
| filter @message like /ERROR/
| sort @timestamp desc
| limit 50
Count 500 responses by path:
fields @timestamp, path, status
| filter status = 500
| stats count() by path
| sort count desc
Trace a request ID across services:
fields @timestamp, @message
| filter @message like /req-abc-123/
| sort @timestamp asc
Save useful queries. Share them with the team so investigations start from a template, not a blank editor.
Custom metrics without drowning in cost
CloudWatch charges per metric and per API call. Custom metrics are powerful but easy to overuse.
Guidelines:
- Aggregate before publishing. Emit p95 latency per minute, not every request.
- Use Embedded Metric Format (EMF) in logs — structured JSON log lines that CloudWatch extracts into metrics without separate
PutMetricDatacalls. - Set retention policies on log groups (7, 30, or 90 days depending on compliance needs).
- Use metric filters to turn log patterns into metrics when EMF is not an option.
Example EMF log line:
{
  "_aws": {
    "Timestamp": 1695000000000,
    "CloudWatchMetrics": [{
      "Namespace": "MyApp/Orders",
      "Dimensions": [["Environment"]],
      "Metrics": [{"Name": "OrderLatency", "Unit": "Milliseconds"}]
    }]
  },
  "Environment": "production",
  "OrderLatency": 142
}
CloudWatch vs third-party observability tools
Datadog, New Relic, Grafana Cloud, and Honeycomb offer richer UX and cross-cloud views. Teams still keep CloudWatch because:
- It is native to AWS with zero agent setup for many services.
- It integrates with IAM, CloudTrail, and Auto Scaling without extra vendors.
- It satisfies baseline monitoring for compliance checklists.
Common pattern: CloudWatch for infrastructure alarms and AWS-native automation; a third-party tool for developer-centric tracing and long-term analytics. OpenTelemetry collectors can fan out to both.
Container and Lambda specifics
ECS/Fargate: Use the awslogs log driver. Ship task-level metrics via Container Insights (adds cost but simplifies cluster visibility).
Lambda: Watch Errors, Duration, Throttles, and ConcurrentExecutions. Set alarms on error rate and duration approaching timeout. Use Lambda Insights for cold start and memory analysis.
EKS: Container Insights or Prometheus with Amazon Managed Service for Prometheus (AMP) and Grafana (AMG) for Kubernetes-native dashboards.
Security and access control
- Scope IAM policies to specific log groups and metric namespaces.
- Encrypt log groups with KMS when handling sensitive data.
- Restrict
logs:FilterLogEventsandcloudwatch:GetMetricDatato roles that need them. - Enable CloudTrail logging for alarm and dashboard changes.
Never log secrets, full credit card numbers, or raw authentication tokens. Use structured logging and redact at the source.
Troubleshooting gaps in your monitoring
"I do not see my application's logs."
Check the IAM role attached to EC2/Lambda/ECS task. Confirm the log group exists and retention is not zero. Verify the agent configuration file points to the correct region.
"Metrics exist but alarms never fire."
Confirm the alarm evaluates the same statistic and period as the graph you are eyeballing. Missing data treatment (notBreaching, breaching, ignore) changes behavior during gaps.
"Costs spiked."
Audit custom metric cardinality (unique dimension combinations explode quickly). Shorten log retention. Delete unused dashboards and alarms.
FAQ
What is the difference between CloudWatch and CloudTrail?
CloudWatch monitors performance and operational health. CloudTrail records AWS API calls for audit and security analysis.
How long are metrics retained?
Standard resolution metrics: 15 months. High-resolution (1-second) metrics: 3 hours at full resolution, then rolled up.
Can CloudWatch monitor on-premises servers?
Yes, via the CloudWatch agent and hybrid activations, though many teams prefer on-prem tools for that layer.
Is CloudWatch included for free?
Basic monitoring metrics for many AWS services are free. Logs storage, custom metrics, alarms, and Insights queries are billed separately.
How do I connect CloudWatch to Slack?
SNS topic → Lambda function that posts to Slack, or use AWS Chatbot for a managed integration.
A 30-day rollout plan for small teams
Week 1: Enable log retention policies on all Lambda and ECS log groups. Create one dashboard for your highest-traffic service.
Week 2: Add error-rate and latency alarms with SNS notifications. Write a one-page runbook for each alarm.
Week 3: Introduce Logs Insights saved queries for common incident questions. Tag custom metrics with Environment and Service dimensions.
Week 4: Review alarm history, silence noisy alerts, and document gaps discovered during the month. Schedule a 60-minute retro with engineering and product to capture lessons.
This cadence beats enabling every CloudWatch feature on day one and never tuning again.
CloudWatch will not replace a full observability culture, but mastering logs, metrics, and alarms on AWS closes the gap between "something feels wrong" and "here is the graph that proves it." Start with one critical service, add an error-rate alarm with a runbook, and expand coverage from there.
Further Reading
Discover more articles on similar topics across our network

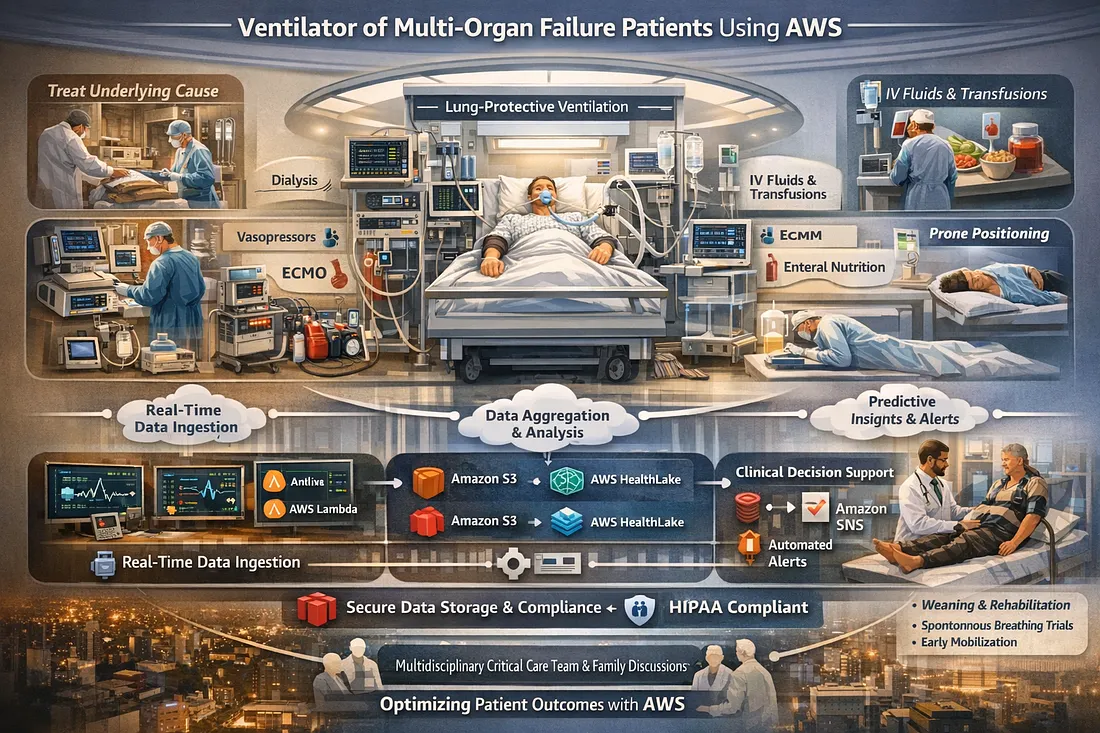
Ventilator Vanguard: AI-Powered MultiOrganFailure Survival Engine Using AWS
Cubed

Comments
Loading comments…