“Running infrastructure is not enough. Monitoring it, observing it, and managing it intelligently — that is real DevOps.”
Introduction
This is not just another theoretical blog about AWS CloudWatch.
This is a real hands-on implementation where I:
- Launched an EC2 instance on AWS
- Installed Nginx web server
- Observed CloudWatch metrics in real time
- Generated artificial CPU load to simulate stress
- Watched metrics spike live on the CloudWatch dashboard
- Created a CloudWatch Alarm with a 70% CPU threshold
- Configured SNS to send email notifications
- Received an actual alert email on my phone
Along the way, I also cover the deeper concepts behind monitoring, observability, metrics, alarms, AIOps, and the CloudWatch Agent — so this blog is useful for beginners, DevOps learners, and anyone preparing for AWS interviews.
Let’s get into it.
What is AWS CloudWatch?
AWS CloudWatch is a monitoring and observability service for AWS resources and applications.
It helps you:
- Collect metrics from EC2, RDS, Lambda, and other services
- Monitor logs from applications and systems
- Trigger alarms based on thresholds
- Visualize data on dashboards
- Send alerts via SNS, email, or SMS
- Detect anomalies automatically
In simple terms, here is the flow:
Your Infrastructure
        ↓
CloudWatch Collects Metrics & Logs
        ↓
Dashboards + Alarms + Alerts
        ↓
Full Observability
Why is CloudWatch Important in Production?
In real production environments:
- Servers are running 24/7
- Applications handle thousands of requests per minute
- Databases take heavy read/write loads
- Containers scale dynamically
Without monitoring, you are flying blind. You will not detect CPU overloads, memory issues, disk bottlenecks, or network spikes until users start complaining — and by then the damage is done.
CloudWatch gives your team eyes on your infrastructure at all times.
Core Components of CloudWatch
Metrics
Numerical time-series data collected from AWS services. Examples: CPUUtilization, NetworkIn, DiskReadOps, MemoryUsage.
Logs
Application and system logs collected and stored for analysis. Examples: Nginx access logs, application error logs, system logs.
Alarms
Condition-based notifications. For example: if CPU > 70% for 1 consecutive period, trigger an alarm and send an email.
Dashboards
Visual panels that graph your metrics over time so you can see trends at a glance.
CloudWatch Agent
An additional software agent you install on EC2 to collect metrics that are NOT available by default — like memory usage, disk usage, and swap.
EventBridge (formerly CloudWatch Events)
Automation triggers that allow you to respond to events in your AWS environment programmatically.
Monitoring vs. Observability — What’s the Difference?
This comes up a lot in DevOps interviews.
Traditional Monitoring Modern Observability Watch predefined metrics Understand system behavior deeply Manual checks Intelligent, automated analysis Limited visibility Full infrastructure visibility Reactive (fix after failure) Proactive (detect before failure) Basic threshold alerts Smart anomaly detection
Monitoring tells you that something is wrong. Observability helps you understand why it is wrong.
CloudWatch gives you both.
What is AIOps?
AIOps = Artificial Intelligence for IT Operations
AWS is actively building AI capabilities into CloudWatch. New features include:
- AI Operations panel in the CloudWatch sidebar
- GenAI Observability for AI workloads
- Application Signals for service-level insights
- Anomaly Detection powered by machine learning
- Intelligent recommendations for alarm tuning
These features allow CloudWatch to automatically detect unusual behavior, analyze incidents, and suggest fixes — without a human having to watch dashboards all day.
Lab Architecture
Here is the setup I built for this lab:
EC2 Instance (Ubuntu, t2.micro)
        ↓
Nginx Web Server (port 80)
        ↓
CloudWatch Metrics (CPU, Network, Disk)
        ↓
CloudWatch Alarm (CPU > 70%)
        ↓
SNS Topic → Email Subscription
        ↓
Alert Email Received on Phone
Step 1 — Launch EC2 Instance
I launched a new EC2 instance in the US East (N. Virginia) region with the following configuration:
- AMI: Ubuntu Server 24.04 LTS
- Instance type: t2.micro (free tier eligible)
- Public IP: Enabled
- Security Group: HTTP (port 80) and SSH (port 22) open
The instance was named cloudwatch-lab.
Step 2 — Connect to EC2 via EC2 Instance Connect
I used AWS EC2 Instance Connect directly from the browser — no need to manage SSH keys locally.
Once connected, the terminal showed the Ubuntu prompt, and I was ready to run commands.
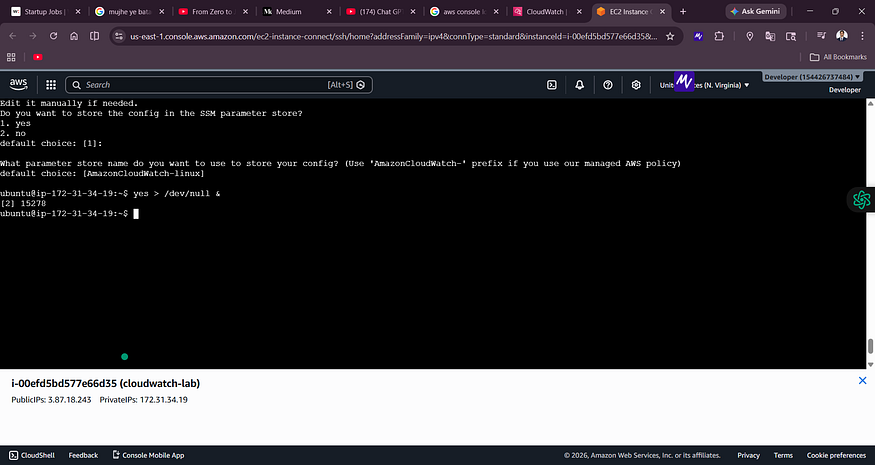
Screenshot 1 — EC2 Instance Connect Terminal
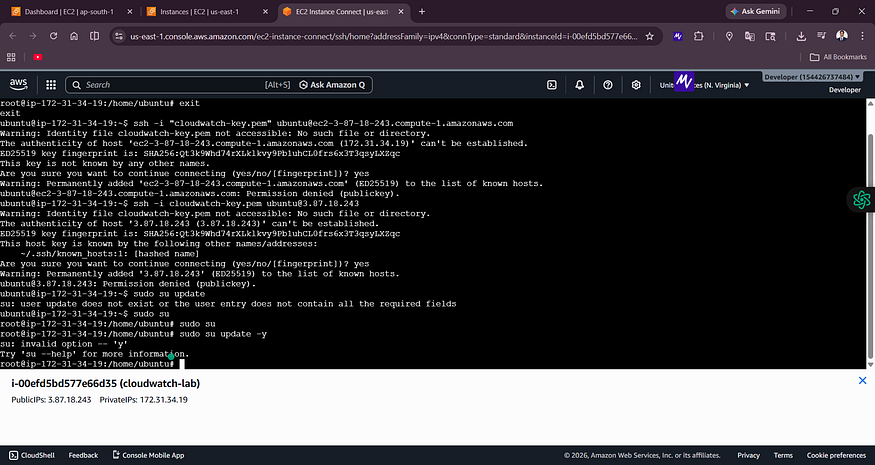
![EC2 Instance Connect showing SSH connection attempts and cloudwatch-lab instance details with Public IP 3.87.18.243]
The terminal connected to the cloudwatch-lab instance. You can see the Public IP (3.87.18.243) and Private IP (172.31.34.19) at the bottom.
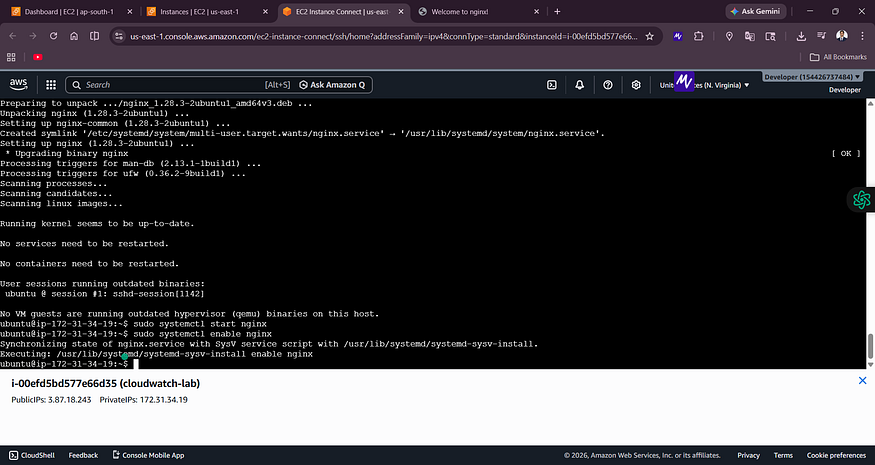
Step 3 — Install Nginx Web Server
sudo apt update -y
sudo apt install nginx -y
sudo systemctl start nginx
sudo systemctl enable nginx
After installation, I opened the public IP address (3.87.18.243) in a browser. The Welcome to nginx! page appeared, confirming that:
- The EC2 instance was running correctly
- Nginx was installed and serving traffic
- The security group was configured correctly to allow HTTP
Screenshot 2 — Nginx Welcome Page
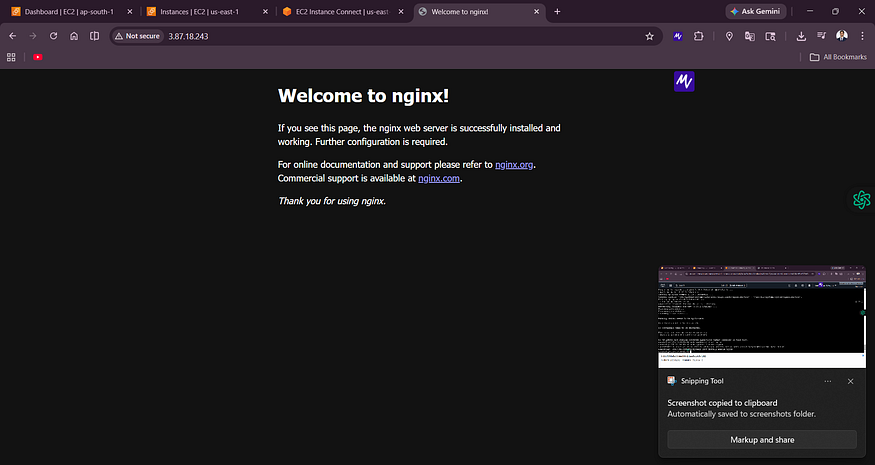
![Browser showing “Welcome to nginx!” at IP 3.87.18.243 confirming successful installation]
The nginx default page confirms the web server is live and accessible from the internet.
Step 4 — Open CloudWatch and Browse Metrics
In the AWS Console, I navigated to CloudWatch → Metrics → All Metrics.
The metrics explorer showed namespaces including EC2 (22 metrics), EBS (15 metrics), Logs, and Usage.
Screenshot 3 — CloudWatch Metrics Explorer
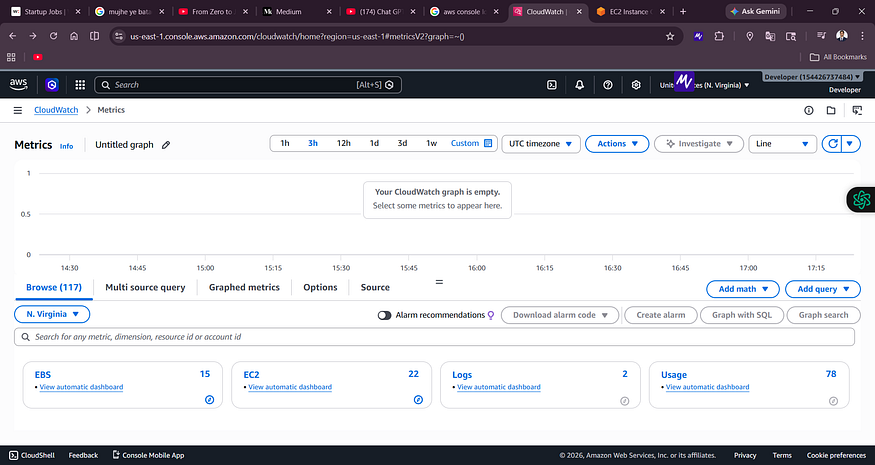
![CloudWatch Metrics page showing Browse tab with EC2 (22), EBS (15), Logs (2), and Usage (78) namespaces]
The CloudWatch Metrics console in N. Virginia. You can browse metrics by namespace — EC2, EBS, Logs, etc.
Important note for beginners: CloudWatch is region-specific. If your EC2 instance is in
us-east-1(N. Virginia) but you are looking at CloudWatch inap-south-1(Mumbai), you will see no metrics. Always check that your CloudWatch region matches your EC2 region.
Step 5 — CloudWatch EC2 Dashboard
After browsing to the EC2 automatic dashboard, I could see real-time graphs for:
- CPU Utilization — showing a low baseline (~0.1%)
- NetworkIn — showing recent traffic spikes
- DiskReadBytes, DiskWriteOps (no data yet at this point)
Screenshot 4 — CloudWatch EC2 Dashboard (Before Load)
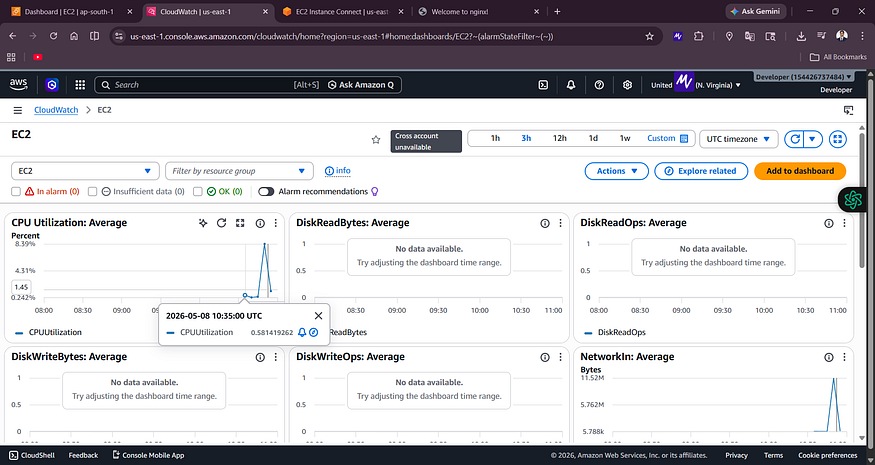
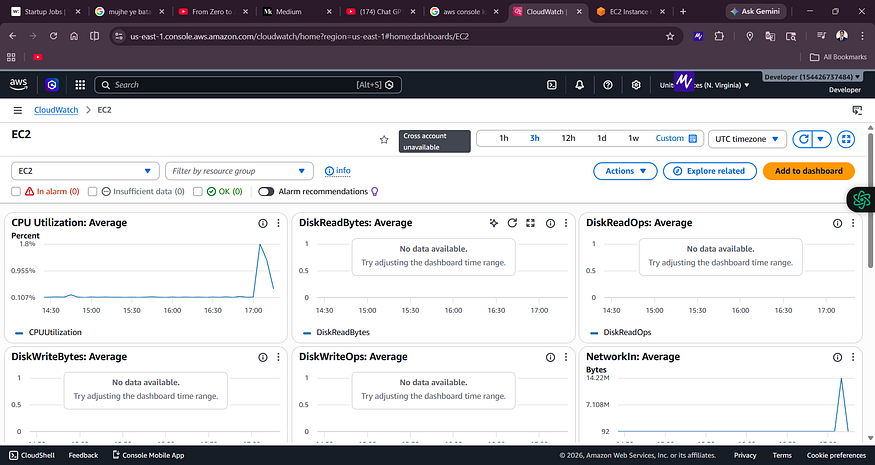
![CloudWatch EC2 dashboard showing CPU Utilization Average at low values around 0.107% and NetworkIn graph]
The EC2 dashboard at idle state. CPU is barely used, which is expected for a fresh instance.
Step 6 — Install the CloudWatch Agent
The default CloudWatch metrics for EC2 do not include memory usage. To collect memory, disk, and other system-level metrics, you need to install the Amazon CloudWatch Agent.
First, I tried the standard apt package:
sudo apt install amazon-cloudwatch-agent -y
This failed with Unable to locate package amazon-cloudwatch-agent. So I downloaded it directly from the S3 distribution URL:
wget https://s3.amazonaws.com/amazoncloudwatch-agent/ubuntu/amd64/latest/amazon-cloudwatch-agent.deb
sudo dpkg -i -E ./amazon-cloudwatch-agent.deb
Screenshot 5 — CloudWatch Agent Installation
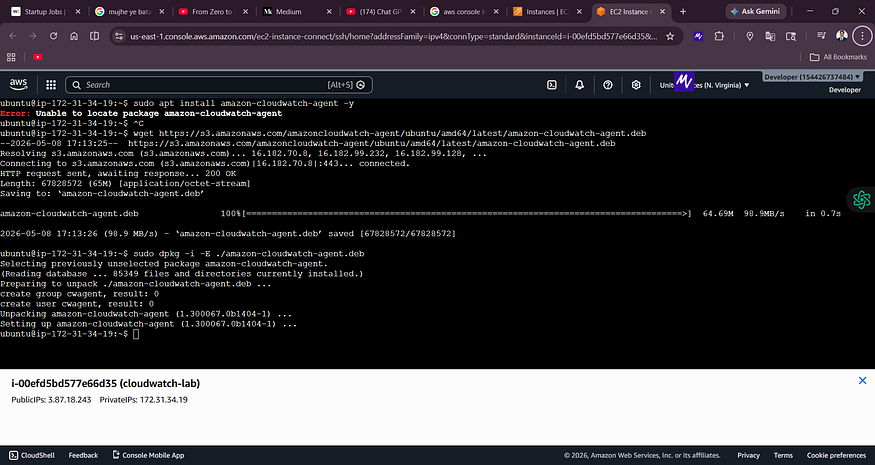
![Terminal showing wget download of amazon-cloudwatch-agent.deb at 98.9 MB/s and successful dpkg installation]
The agent downloaded at 98.9 MB/s and installed successfully via dpkg. This is the correct method for Ubuntu when the apt package is not available.
Step 7 — Create an IAM Role for the CloudWatch Agent
The CloudWatch Agent needs AWS permissions to push metrics to CloudWatch. I created an IAM Role called CloudWatchAgentRole with the following configuration:
- Trusted entity: EC2 service
- Policy:
CloudWatchAgentServerPolicy
Screenshot 6 — IAM Role Created

![IAM Roles page showing CloudWatchAgentRole successfully created with Trusted entity: AWS Service: ec2]
The CloudWatchAgentRole appears in the IAM Roles list. This role will be attached to the EC2 instance so the agent can send metrics to CloudWatch.
After creating the role, I attached it to the EC2 instance via EC2 → Actions → Security → Modify IAM Role.
Step 8 — Check CloudWatch Agent Status
After installation, I checked whether the agent was running:
sudo systemctl status amazon-cloudwatch-agent
Screenshot 7 — CloudWatch Agent Status
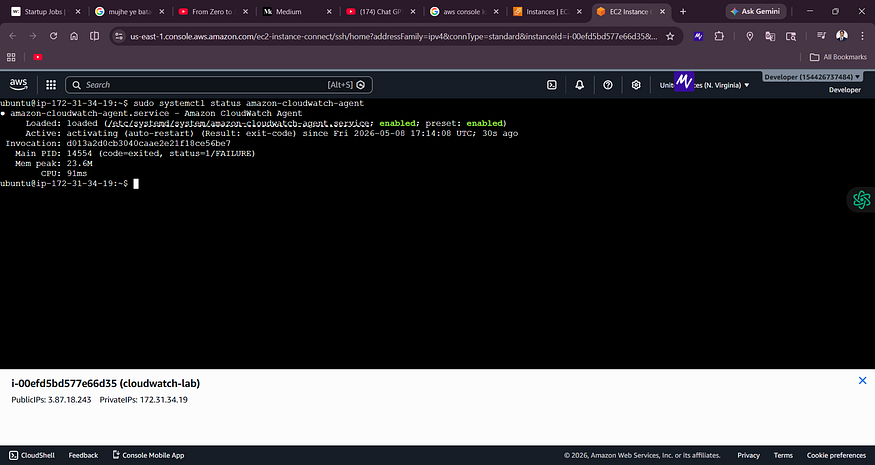
![Terminal showing amazon-cloudwatch-agent.service status as activating (auto-restart) with exit-code FAILURE]
The agent shows a FAILURE status here — it needs a configuration file before it can start. This is expected at this stage.
The agent requires a configuration file (usually generated via sudo /opt/aws/amazon-cloudwatch-agent/bin/amazon-cloudwatch-agent-config-wizard) to know which metrics and logs to collect. Once configured, the agent starts successfully and begins pushing custom metrics.
Step 9 — Generate Artificial CPU Load
To actually test CloudWatch monitoring, I needed to stress the CPU. I used this simple command:
yes > /dev/null &
How it works:
yescontinuously outputs the letter "y"> /dev/nulldiscards the output (so it does not fill up disk)&runs it in the background
The result: the CPU gets pinned at ~100% because it is constantly generating output with no pause.
Screenshot 8 — CPU at 100% Under Load
![Top command showing PID 15925 and 16497 both running ‘yes’ at 100% CPU utilization, load average 1.99]
The top command confirms the CPU is pegged at 100%. Two yes processes are consuming all available CPU cycles.
Step 10 — Watch the CPU Spike in CloudWatch
Within 1–3 minutes, the CloudWatch dashboard reflected the CPU spike visually.
Screenshot 9 — CPU Spike on CloudWatch Dashboard
![CloudWatch EC2 dashboard showing a sharp CPU utilization spike reaching 8.39% average around 10:35 UTC]
The CPU Utilization graph shows a sharp spike — this is the real-time result of the yes command stress test. CloudWatch detected and visualized the load automatically.
Step 11 — Stop the CPU Stress
Once I had confirmed the spike was visible in CloudWatch, I killed the stress processes:
pkill yes
Screenshot 10 — Stopping the CPU Load
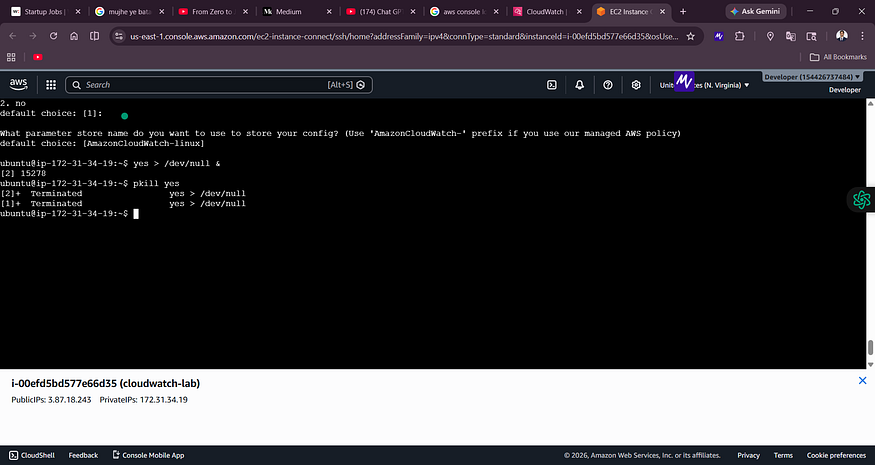
![Terminal showing pkill yes command terminating two background ‘yes’ processes]
Both background yes processes terminated. The CPU returned to normal, and the CloudWatch graph gradually came back down.
Step 12 — Create a CloudWatch Alarm
Now for the most important part: automated alerting.
I navigated to CloudWatch → Alarms → Create Alarm and configured the following:
- Metric: EC2 → Per-Instance Metrics → CPUUtilization
- Statistic: Average
- Period: 1 minute
- Condition: Greater than 70%
- Evaluation period: 1 out of 1 datapoints
- Alarm name:
HighCPUAlarm
For the notification action, I created a new SNS topic and subscribed my email address.
Screenshot 11 — HighCPUAlarm Created
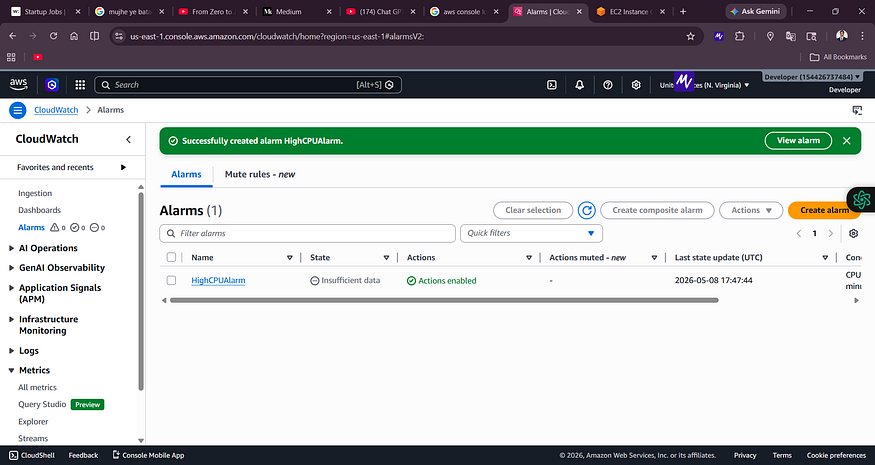
![CloudWatch Alarms page showing HighCPUAlarm successfully created with state “Insufficient data” and Actions enabled]
The alarm was created successfully. The initial state is “Insufficient data” — this is normal. It means CloudWatch is waiting to collect enough datapoints before it can evaluate the threshold.
Step 13 — Confirm SNS Email Subscription
After creating the SNS topic, AWS sent a subscription confirmation email to my inbox. I clicked “Confirm subscription” to activate it.
Without this confirmation step, the alarm will not be able to send email notifications.
Step 14 — Trigger the Alarm
I ran the CPU stress again:
yes > /dev/null &
yes > /dev/null &
Within a few minutes, the CPU crossed the 70% threshold and CloudWatch transitioned the alarm state from:
OK → ALARM
Step 15 — Receive the Email Alert
And then — the email arrived on my phone.
Screenshot 12 — AWS SNS Alert Email in Inbox
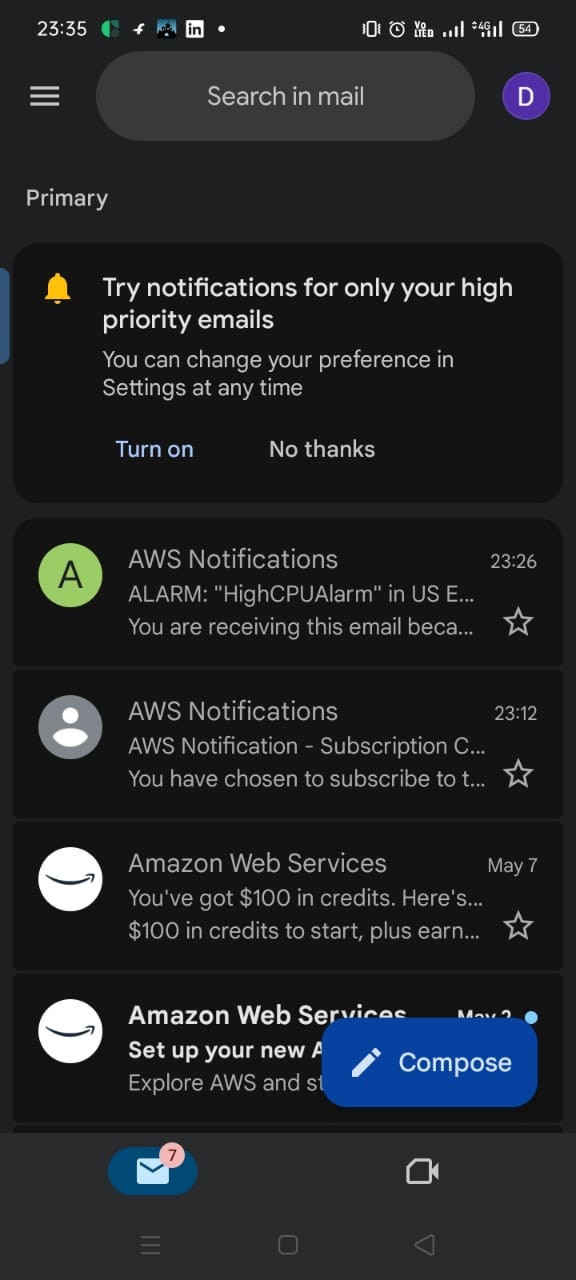
![Gmail inbox showing AWS Notifications email about ALARM: HighCPUAlarm in US East received at 23:26]
The alert email landed in my inbox within minutes of the CPU threshold being crossed.
Screenshot 13 — Full Alert Email Details
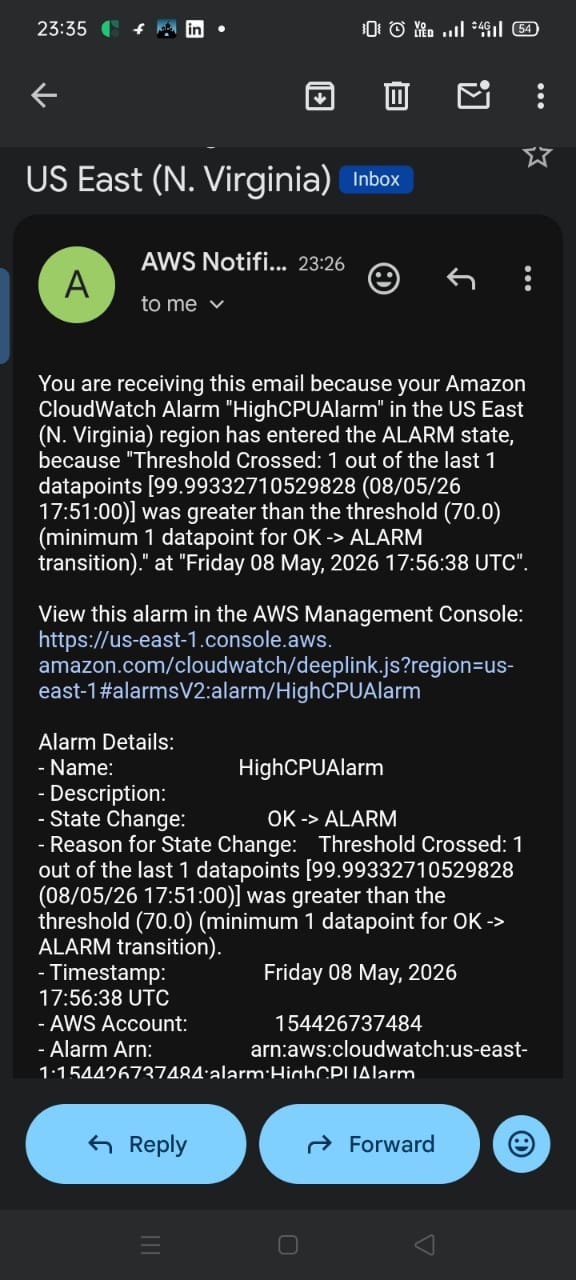
![AWS Notification email showing HighCPUAlarm details: State Change OK to ALARM, CPU value 99.99%, threshold 70.0%, timestamp Friday 08 May 2026 17:56:38 UTC]
The email contains full alarm details: the alarm name, threshold crossed (99.99% > 70%), the exact timestamp (Friday 08 May 2026, 17:56:38 UTC), the AWS account ID, and the Alarm ARN.
This is exactly how production alerting works in real companies. Engineers receive these emails (or Slack/PagerDuty notifications) and respond to incidents immediately.
Understanding CloudWatch Alarm States
State Meaning OK Metric is within the defined threshold. Everything normal. ALARM Threshold crossed. Notification triggered. INSUFFICIENT_DATA Not enough data collected yet to evaluate the condition.
CloudWatch Data Flow — End to End
EC2 Instance Activity (CPU, Network, Disk)
                ↓
AWS Hypervisor Collects Metrics
                ↓
CloudWatch Stores Metrics (1-minute granularity)
                ↓
Dashboard Visualizes Data
                ↓
Alarm Evaluates Threshold Every Period
                ↓
Threshold Crossed → State = ALARM
                ↓
SNS Topic Triggered
                ↓
Email Sent to Subscriber
                ↓
Engineer Receives Alert
Why CloudWatch Agent Matters
Default CloudWatch metrics only cover what the AWS hypervisor can observe from outside the instance:
- CPU Utilization
- Network In/Out
- Disk Read/Write Ops (for instance store, not EBS)
But memory usage is not available by default. The hypervisor cannot see inside the OS to know how much RAM is being used.
The CloudWatch Agent runs inside the EC2 instance and enables advanced system-level monitoring beyond the default EC2 metrics.
| Metric | Available Without Agent | Available With Agent | | — -| — -| — -| | CPU Utilization | Yes | Yes | | Network In/Out | Yes | Yes | | Memory Usage | No | Yes | | Disk Usage (%) | No | Yes | | Swap Usage | No | Yes | | Custom Application Logs | No | Yes |
By default, Amazon CloudWatch provides infrastructure-level metrics such as CPU and network utilization. However, operating system metrics like memory usage, disk utilization, and custom log collection require the CloudWatch Agent.
In production environments, installing the CloudWatch Agent is considered a standard best practice because it provides deeper observability into system behavior and application performance.
CloudWatch vs Other Tools
CloudWatch vs Prometheus
CloudWatch Prometheus Management AWS managed Self-managed Setup Easy, built-in Complex Integration Native AWS Kubernetes-focused Cost Pay per metric/request Infrastructure overhead Best for AWS-native workloads Multi-cloud / on-prem
CloudWatch vs Grafana
CloudWatch Grafana Primary purpose Metrics collection + storage Visualization Dashboards Good, AWS-native Excellent, multi-source Data sources AWS only CloudWatch, Prometheus, Datadog, and more
In many teams, CloudWatch + Grafana are used together — CloudWatch collects the data, Grafana visualizes it beautifully.
Real-World Use Cases
High CPU Detection — Catch application overload before users notice performance degradation.
Auto Scaling Triggers — CloudWatch alarms can trigger EC2 Auto Scaling to launch new instances when CPU stays above a threshold for several minutes.
Application Error Monitoring — Use CloudWatch Logs Insights to detect error rates, 5xx responses, and latency spikes.
Security Monitoring — Trigger alarms on unusual API activity detected via CloudTrail logs.
Cost Control — Alarm on unexpectedly high AWS usage metrics to catch runaway services.
Interview Questions
Q: What is the difference between monitoring and observability? Monitoring watches predefined metrics and alerts when thresholds are crossed. Observability is the ability to understand the internal state of a system from its external outputs — including metrics, logs, and traces together.
Q: Why is memory not available as a default CloudWatch metric? Because CloudWatch collects metrics from the AWS hypervisor, which sits outside the EC2 instance. It cannot see inside the OS. Memory usage requires the CloudWatch Agent running inside the instance.
Q: What is an SNS topic? SNS (Simple Notification Service) is AWS’s pub/sub messaging service. An alarm publishes a message to an SNS topic, and all subscribers (email, SMS, Lambda, SQS) receive the notification.
Q: What does INSUFFICIENT_DATA mean in a CloudWatch alarm? It means CloudWatch has not yet collected enough metric datapoints to evaluate the alarm condition. It is normal when an alarm is first created or when an instance has been stopped.
Q: What is AIOps in the context of CloudWatch? AIOps refers to using AI and ML to automate IT operations. CloudWatch now includes AI Operations features, anomaly detection, and GenAI Observability — allowing it to automatically detect abnormal behavior and suggest corrective actions.
Key Takeaways from This Lab
- CloudWatch is region-specific — always match your region
- Default metrics do not include memory — install the CloudWatch Agent
- CPU stress testing with
yes > /dev/null &is a simple and effective method - Alarms start in INSUFFICIENT_DATA state — this is normal
- SNS subscription must be confirmed via email before alerts work
- The full monitoring → alerting pipeline can be set up in under 30 minutes
What’s Next?
If you want to go deeper, here is what to explore next:
- CloudWatch Logs Insights — Query logs with SQL-like syntax
- CloudWatch Agent advanced config — Collect memory, disk, and custom app logs
- Auto Scaling integration — Use alarms to automatically scale EC2 fleets
- Lambda alerts — Monitor serverless function errors and duration
- Grafana integration — Build richer dashboards on top of CloudWatch data
- Container Insights — Monitor ECS and EKS clusters
- Application Signals — Service-level observability for microservices
- AI Operations — Explore CloudWatch’s new AI-powered features
Final Architecture
EC2 Instance (cloudwatch-lab)
        ↓
Nginx Web Server
        ↓
CloudWatch Agent (custom metrics)
        ↓
CloudWatch Metrics (CPU, Memory, Disk, Network)
        ↓
CloudWatch Alarm: HighCPUAlarm (threshold > 70%)
        ↓
SNS Topic → Email Subscription
        ↓
Alert Email → Engineer's Inbox
        ↓
Operational Visibility
Conclusion
In this lab, I went from zero to a fully working monitoring and alerting system on AWS:
1.EC2 instance launched and configured 2. Nginx installed and verified 3. CloudWatch metrics explored 4. Real CPU load generated and observed 5. CloudWatch Alarm created with a 70% threshold 7. SNS email notifications configured 8. Real alert email received on phone 9. CloudWatch Agent installed 10. IAM Role created for agent permissions 11. Observability concepts understood end-to-end
The most important thing this lab taught me is that monitoring is not optional in production. It is the foundation of operational reliability. And CloudWatch makes it accessible to every AWS user — from a solo developer to a large enterprise engineering team.
Theory tells you what CloudWatch is. Hands-on labs show you what it actually does.
Build it. Break it. Watch it. That is how you learn.
Written after completing a real AWS hands-on lab. All screenshots are from actual implementation.
Tags: AWS, CloudWatch, EC2, DevOps, Monitoring, Observability, SNS, AIOps, Cloud Computing, Hands-On Lab
Comments
Loading comments…