TL;DR: This is a step-by-step tutorial on the quickest way to add observability to any data ingestion pipeline — whether you’re scraping or using an API.
Anything that fetches data at scale has a class of failure that error handling won’t catch. Not because your error handling code is bad (it probably isn’t) but because retries that eventually succeed, queries that take 10x longer than average, and domains that silently time out — don’t throw exceptions because they’re not technically errors. And you’ll never know. The solution is actually adding proper observability.
Overkill? Not at all. Because a data pipeline — any data pipeline — with network calls, retries, timeouts, and wildly variable latency across different queries and domains is a textbook distributed system. It has all the same failure modes, and so it deserves the same tooling.
In this post, we’ll build a SERP pipeline on top of Bright Data’s API and instrument it with OpenTelemetry (See: Python docs), the open-source standard for distributed tracing. Bright Data reduces blocks and proxy headaches out of the box — but proper Otel tracing shows you exactly where risk remains.
By the end, you’ll be able to see what each call costs you in time, where retries are hiding, and which queries are slow.
What This Actually Gets You
What I’m trying to do is surface problems you’ll probably run into, and otherwise just silently pay for. These patterns map nearly 1:1 to wherever your data ingest pipelines look like in production.
- Retry storm detection. If a domain starts blocking aggressively, you won’t see it as hard errors anymore, but a creeping spike in
scraper.retries > 0spans. That’s your early warning before you trigger a full ban or blow past your proxy quota for the month. - Actual cost visibility. Every retry is another proxy request. If you’re paying per request or per GB, scraper.retries on your spans maps directly to a line item on your invoice. You can aggregate this and alert on it — I haven’t been doing this before adding OTel, and most likely, neither have you. 😅
- Per-query latency profiling. Some queries are just structurally slower — more competitive terms, heavier result pages, more contention in the proxy pool. Traces let you see this per-query instead of as a blended average that makes everything look fine. Once you can see the outliers, you can do something about them.
Basically, if you take ONE thing away from this read, let it be this: data pipelines have exactly the same failure modes as any distributed system — timeouts, partial failures, retry amplification, silent degradation — whether data is obtained via an API call or just scraping.
So let’s build a data collection stack you can reason about. And, as it turns out, the tooling you’d use for microservices works perfectly well here too.
The Setup
Here’s what you need:
opentelemetry-api>=1.20.0
opentelemetry-sdk>=1.20.0
opentelemetry-instrumentation-requests>=0.41b0
opentelemetry-exporter-otlp-proto-http>=1.20.0
requests>=2.28.0
python-dotenv>=1.0.0
The important ones:
- opentelemetry-instrumentation-requests — this gives us automatic HTTP tracing. Zero manual work.
- opentelemetry-exporter-otlp-proto-http — for when we want to send traces somewhere real, like Jaeger.
Before running pip install -r requirements.txt, create a .env file with:
BRIGHT_DATA_API_KEY=your_api_key
BRIGHT_DATA_ZONE=serp # or your SERP zone name from Bright Data dashboard
BRIGHT_DATA_COUNTRY=us # optional
OTEL_EXPORTER=console   # set to "jaeger" to send traces to Jaeger (must be running)
The client reads these on instantiation. Replace with your own API credentials if you need them, but don’t forget OTEL_EXPORTER — it controls where traces go.
Initializing OpenTelemetry
We want two modes: a console exporter for development where traces print right in the terminal, and an OTLP exporter for production. A single env var switches between them:
import os
from opentelemetry import trace
from opentelemetry.instrumentation.requests import RequestsInstrumentor
from opentelemetry.sdk.trace import TracerProvider
from opentelemetry.sdk.trace.export import BatchSpanProcessor, ConsoleSpanExporter
from opentelemetry.sdk.resources import SERVICE_NAME, Resource


def init_otel(exporter: str = "console", service_name: str = "bd-scraper"):
    resource = Resource.create(attributes={SERVICE_NAME: service_name})
    provider = TracerProvider(resource=resource)

    if exporter == "jaeger":
        from opentelemetry.exporter.otlp.proto.http.trace_exporter import OTLPSpanExporter
        endpoint = os.getenv("OTEL_EXPORTER_OTLP_ENDPOINT", "http://localhost:4318")
        processor = BatchSpanProcessor(OTLPSpanExporter(endpoint=f"{endpoint}/v1/traces"))
    else:
        processor = BatchSpanProcessor(ConsoleSpanExporter())

    provider.add_span_processor(processor)
    trace.set_tracer_provider(provider)
    RequestsInstrumentor().instrument()  # this is where the magic happens!
    return trace.get_tracer(service_name, "1.0.0")
That one line — RequestsInstrumentor().instrument() — hooks into the requests library globally. Every HTTP call your code makes from this point forward gets a trace span, including the ones in third-party code you didn’t write. You get that for free.
One thing that’ll catch you out if you’re not careful: init_otel must run before any requests.Session is created. That means calling it before importing BrightDataClient in your entrypoint. Yes, the import order matters here.
The Client with Custom Spans
Automatic HTTP tracing is great, but it only tells you about the transport layer. It has no idea this call was for the query “machine learning”, or that it targeted google.com, or that it had to retry once before it worked. That context is what custom spans are for.
import json
import os
import time
import requests
from typing import Optional

from dotenv import load_dotenv
load_dotenv()


class BrightDataClient:
    def __init__(        self,
        api_key: Optional[str] = None,
        zone: Optional[str] = None,
        country: Optional[str] = None,    ):
        self.api_key = api_key or os.getenv("BRIGHT_DATA_API_KEY")
        self.zone = zone or os.getenv("BRIGHT_DATA_ZONE")
        self.country = country or os.getenv("BRIGHT_DATA_COUNTRY")
        self.api_endpoint = "https://api.brightdata.com/request"

        if not self.api_key or not self.zone:
            raise ValueError("BRIGHT_DATA_API_KEY and BRIGHT_DATA_ZONE required (env or constructor)")

        self.session = requests.Session()
        self.session.headers.update({
            "Content-Type": "application/json",
            "Authorization": f"Bearer {self.api_key}",
        })

    def search(        self,
        query: str,
        num_results: int = 10,
        language: Optional[str] = None,
        country: Optional[str] = None,
        max_retries: int = 2,    ) -> dict:
        from opentelemetry import trace
        from opentelemetry.trace import StatusCode

        tracer = trace.get_tracer(__name__, "1.0.0")
        target_domain = "google.com"

        with tracer.start_as_current_span("bright_data.search") as span:
            span.set_attribute("scraper.query", query)
            span.set_attribute("scraper.target_domain", target_domain)
            span.set_attribute("scraper.num_results", num_results)

            start = time.perf_counter()
            last_err = None

            for attempt in range(max_retries + 1):
                try:
                    result = self._do_search(query, num_results, language, country)
                    latency_ms = (time.perf_counter() - start) * 1000
                    span.set_attribute("scraper.latency_ms", round(latency_ms, 2))
                    span.set_attribute("scraper.retries", attempt)
                    # clean success — no retries needed
                    if attempt == 0:
                        span.set_status(StatusCode.OK)
                    else:
                        # recovered, but we want this surfaced in Jaeger
                        span.set_status(StatusCode.ERROR, "Recovered after retry")
                    return result
                except Exception as e:
                    last_err = e
                    span.set_attribute("scraper.retries", attempt + 1)
                    if attempt `< max_retries:
                        time.sleep(0.5 * (attempt + 1))

            # all retries exhausted
            span.set_attribute("scraper.error", str(last_err))
            span.set_status(StatusCode.ERROR, str(last_err))
            span.record_exception(last_err)
            raise last_err

    def _do_search(        self,
        query: str,
        num_results: int,
        language: Optional[str],
        country: Optional[str],    ) ->` dict:
        search_url = (
            f"https://www.google.com/search"
            f"?q={requests.utils.quote(query)}&num={num_results}&brd_json=1"
        )
        if language:
            search_url += f"&hl={language}&lr=lang_{language}"
        target_country = country or self.country
        payload = {"zone": self.zone, "url": search_url, "format": "json"}
        if target_country:
            payload["country"] = target_country

        response = self.session.post(self.api_endpoint, json=payload, timeout=30)
        response.raise_for_status()
        result = response.json()
        # Bright Data may return body as JSON string — unpack it
        if isinstance(result, dict) and "body" in result:
            body = result["body"]
            result = json.loads(body) if isinstance(body, str) else body
        return result
I’m using a SERP API for data, but swap it out with whatever you’re using. The concepts apply to anything. Also, a couple of things worth understanding here:
The Parent-Child Relationship
The _do_search helper builds the target URL and POSTs it to our API endpoint (api.brightdata.com/request). When that call runs, the RequestsInstrumentor auto-creates a child POST span inside our bright_data.search parent span. They share the same trace_id.
In Jaeger, you’ll get a proper timeline: the outer business operation wrapping the inner HTTP call. That nesting is what makes traces actually useful — you see the whole story, not just individual events.
You Have to Set Span Status Yourself
This one surprised me. OTel records all the data you throw at it, but it won’t decide what matters on your behalf. If you don’t explicitly call [span.set_status(…)](https://opentelemetry.io/docs/languages/python/instrumentation/#set-span-status), every span stays UNSET — even when a retry happened underneath. A query that timed out, retried, and recovered would be completely invisible to a Jaeger filter like status=ERROR. You’d never find it.
So there’s a deliberate tradeoff we’re making in the code above: recovered retries are marked ERROR so they show up in dashboards. Some teams prefer to use OK and add a scraper.recovered = true attribute instead, keeping error rate metrics clean.
Honestly, both are fine 🤷♂️ It just depends on whether you want alerting to treat “degraded success” as a failure. The important thing is to choose consciously, and not fall through to UNSET by accident.
Putting It All Together
Let’s do this in a file, call it something like scraper.py
import argparse
import os
import time

from dotenv import load_dotenv
load_dotenv()
_exporter = os.getenv("OTEL_EXPORTER", "console") # console fallback as a default

from otel_config import init_otel
init_otel(exporter=_exporter)  # must come before BrightDataClient import

from bright_data_otel import BrightDataClient


def run(calls: int = 10, delay: float = 0.5):
    queries = [
        "python programming", "machine learning", "web development",
        "data science", "cloud computing",
    ]
    client = BrightDataClient()
    start = time.time()
    for i in range(calls):
        q = queries[i % len(queries)]
        try:
            data = client.search(q, num_results=5)
            n = len(data.get("organic", [])) if isinstance(data, dict) else 0
            print(f"  [{i+1}/{calls}] {q}: {n} results")
        except Exception as e:
            print(f"  [{i+1}/{calls}] {q}: error — {e}")
        if i `< calls - 1:
            time.sleep(delay)
    print(f"Done in {time.time() - start:.1f}s")


if __name__ == "__main__":
    p = argparse.ArgumentParser()
    p.add_argument("--count", type=int, default=10)
    p.add_argument("--delay", type=float, default=0.5)
    args = p.parse_args()
    run(calls=args.count, delay=args.delay)
Run it in console mode:
> python scraper.py --count 5
Or point it at Jaeger:
# to be honest, just set OTEL_EXPORTER in .env
> OTEL_EXPORTER=jaeger python scraper.py --count 5
What the Traces Actually Show
Here’s what the terminal printed for my five-query run:
[1/5] python programming: 6 results
[2/5] machine learning: 8 results
[3/5] web development: 9 results
[4/5] data science: 9 results
[5/5] cloud computing: 9 results
Done in 75.1s
Five queries, all with results, no errors printed. Looks perfectly healthy….right? Let’s see what the traces say.
The clean calls…
For python programming, the bright_data.search span looks exactly as expected:
{
  "name": "bright_data.search",
  "attributes": {
    "scraper.query": "python programming",
    "scraper.target_domain": "google.com",
    "scraper.latency_ms": 3686.01,
    "scraper.retries": 0
  }
3.7 seconds, zero retries, one nested POST span confirming the HTTP round-trip happened exactly once. Looks good! Moving on.
…and the ones that weren’t so clean.
The query data science printed 9 results. Except the traces show three spans for that single call:
{
  "name": "POST",
  "status": {
    "status_code": "ERROR",
    "description": "ReadTimeout: ...Read timed out. (read timeout=30)"
  },
  "start_time": "2026-03-20T21:18:24.986273Z",
  "end_time": "2026-03-20T21:18:54.999505Z",
  "events": [{
    "name": "exception",
    "attributes": {
      "exception.type": "requests.exceptions.ReadTimeout",
      "exception.stacktrace": "..."
    }
  }]
}
{
  "name": "POST",
  "status": { "status_code": "UNSET" },
  "start_time": "2026-03-20T21:18:55.505186Z",
  "end_time": "2026-03-20T21:19:20.097874Z"
}
{
  "name": "bright_data.search",
  "attributes": {
    "scraper.query": "data science",
    "scraper.latency_ms": 55113.46,
    "scraper.retries": 1
  }
}
Turns out, this query hit the 30-second read timeout, waited for the retry backoff, tried again, and finally came back with data — costing you two proxy requests and 55 seconds instead of one request and ~4 seconds.
You‘d have absolutely no idea from the terminal output itself.
This happens more often than you think — failures that silently blend in with the clean calls around it, that your pipeline still declare a success. That’s the whole argument for adding observability to your data ingest pipeline, right there.
This failure was invisible. No exception or warning, nothing in your logs. OTel may not have prevented this failure — it has nothing to do with networking or data ingestion — but it definitely made it impossible to miss.
The Latency Breakdown Across All Five Queries
| Query | Latency | Retries |
|---|---|---|
| python programming | 3,686ms | 0 |
| machine learning | 6,558ms | 0 |
| web development | 3,079ms | 0 |
| data science | 55,113ms | 1 |
| cloud computing | 4,600ms | 0 |
The scraper.target_domain attribute lets you aggregate this same breakdown per domain when you scrape multiple targets (e.g. google.com vs bing.com).
Four of five calls were clean. One was 15x slower than average, and you only know that because you were looking at traces.
If you’re running this at scale across hundreds of queries, that pattern — most queries fast, some consistently slow or timeout-prone — is exactly the info you need to tune retry budgets, adjust per-query timeouts, or start asking why that“data science” query keeps choking.
You can’t turn knobs on what you can’t see, after all. Adding observability gives you visibility into things you may not even have thought of.
Going to Production with Jaeger
The console exporter is great for development, but for anything actually running in production you want traces going somewhere persistent. The easiest starting point is Jaeger’s all-in-one Docker image:
docker run -d --name jaeger \
  -p 16686:16686 \
  -p 4318:4318 \
  jaegertracing/all-in-one:latest
Then, as before:
> python scraper.py --count 10
After this run, open http://localhost:16686, search for bd-scraper (or whatever you called yours) and you’ll see each bright_data.search span as a row in the trace timeline with the nested POST spans inside.
The data science query was slow again, but hey, at least it didn’t fail? Small victories. 😅 It stands out immediately in the Jaeger UI — one that’s wider than everything else on the screen (~17 seconds.)
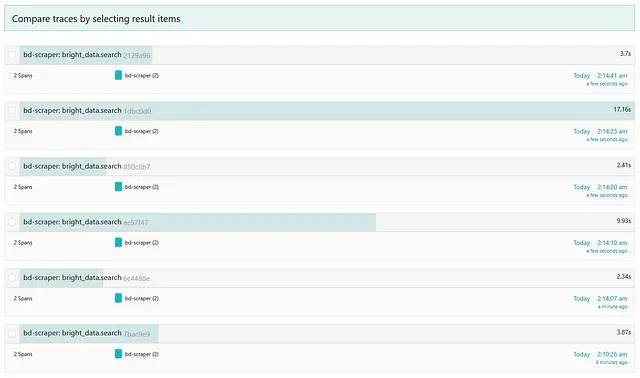
This is what http://localhost:16686/search will look like after a run.
Click through it for more info.
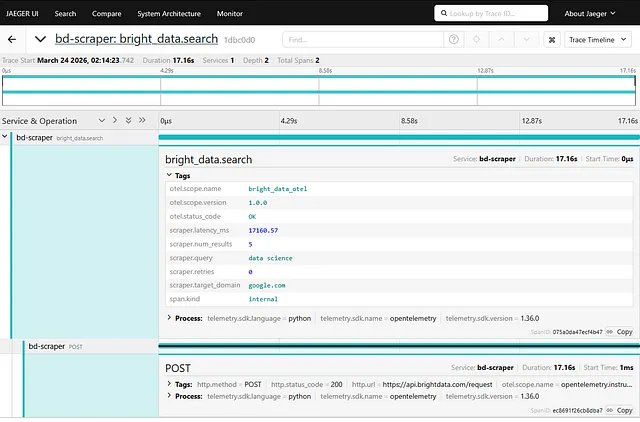
And you can expand through traces here to as fine grained a detail as you need.
For a real setup, swap Jaeger out for whatever backend you already run. Grafana Tempo, Honeycomb, Datadog — the OTLP exporter speaks the same protocol to all of them.
That’s everything! Feel free to reach out on LinkedIn if you have questions, or leave a comment below.👋
Comments
Loading comments…