Note: For non-members, this article is also available here.
Introduction:
Not long ago, I was given a task to write reports with tabular data to pdf. As weird as it sounds, it was indeed a genuine ask. I called it weird because usually, we write reports with huge dynamic data to either a csv or a json or a spreadsheet. However, writing tabular data to pdf was something unusual. Well, who am I to say no? That learning became a motivation to share this post.
Take away:
This post could be useful to anyone who is looking to write structured data to PDF using python and is confused to choose a library. The structured data could be tabular data from a csv or an excel which will be a list of dictionaries. We will take a Python list of dictionaries as input and write it to pdf.
At the end of this article, you must have a pretty good idea of the following:
-
Write table data to PDF.
-
Write structured data as a paragraph to PDF.
-
Choose the right PDF library betweenreportlab, fpdf, weasyprint pdfkit appropriately.
1. Create PDF using reportlab:
ReportLab is an open-source engine for creating complex, data-driven PDF documents and custom vector graphics. It’s free, open-source , and written in Python. > From the docs:
$pip install reportlab
The reportlab library is a comprehensive toolkit that provides a plethora of methods to create, modify a PDF document. The way I see this library, if you want to get something done quickly this may not be the right library to choose. However, if you want full control over creating the document and have plenty of time to play around, you could very well try this.
The reportlab documentation is available here. Now, let's quickly write a python code to create a PDF file. We will use SimpleDocTemplate class to create this document. In my opinion, using a document template elucidates the PDF creation rather than using a canvas in reportlab.
Write a paragraph to pdf:
from reportlab.lib.pagesizes import letter
from reportlab.platypus import SimpleDocTemplate, Paragraph, Spacer
from reportlab.lib.units import inch
from reportlab.lib.styles import getSampleStyleSheet

data = [{"a": 1, "b": 2}, {"c": 3, "d":4}]

def create_pdf():

    story = []

    # Initialise the simple document template
    doc = SimpleDocTemplate(f"blog.pdf",
                            page_size=letter,
                            bottomMargin=.4 * inch,
                            topMargin=.4 * inch,
                            rightMargin=.8 * inch,
                            leftMargin=.8 * inch)

    # set the font style
    styles = getSampleStyleSheet()
    styleN = styles['Normal']

    for count, d in enumerate(data, 1):
        p_count = Paragraph(f" Data: {count} ")
        story.append(Spacer(1, 12))
        story.append(p_count)
        for k, v in d.items():
            # extract and add key value pairs to PDF
            p = Paragraph(k + " : " + str(v), styleN)
            story.append(p)
            story.append(Spacer(1, 2))
    # build PDF using the data
    doc.build(story)

create_pdf()
Output:
Record: 1
a: 1
b: 2

Record: 2
c: 3
d: 4
Explanation:
The SimpleDocTemplate class is derived from BaseDocTemplate which provides its own PageTemplate.
The reportlab.platypus.Paragraph class is one of the most useful of the Platypus Flowables; it can format fairly arbitrary text and provides for inline font style and color changes using an XML style.
The Styles class provides multiple font styles like heading, normal, etc. The story list object holds all the paragraph objects in the order they were appended. Finally, the build(story) generates the document.
Write the table to pdf:
Now that we have written plain text data, let’s try creating a table in pdf.
The Table and LongTable classes derive from the Flowable class and are intended as a simple textual gridding mechanism.
from reportlab.lib.pagesizes import letter
from reportlab.platypus import SimpleDocTemplate, Paragraph, Spacer, Table
from reportlab.lib.units import inch
from reportlab.lib.styles import getSampleStyleSheet

data = [{"a": 1, "b": 2}, {"c": 3, "d":4}]

def generate_pdf_table():

    doc = SimpleDocTemplate(f"blog_table.pdf",
                            page_size=letter,
                            bottomMargin=.4 * inch,
                            topMargin=.6 * inch,
                            rightMargin=.8 * inch,
                            leftMargin=.8 * inch)

    table_headers = [head for head in data[0]]

    items = []
    # Create table object for headers
    th = Table([table_headers])

    items.append(th)

    # Create table object for every row
    for d in data:
        temp_lst = []
        for k, v in d.items():
            temp_lst.append(str(v))
        tr = Table([temp_lst])
        items.append(tr)

    items.append(Spacer(1,1))
    doc.build(items)

generate_pdf_table()
view raw
Output:
a b c d
1 2 3 4
5 6 7 8
Explanation:
The SimpleDocTemplate class is derived from BaseDocTemplate which provides its own PageTemplate. The Table class takes the data and displays them as a table.
Pitfalls:
Though the output seems to be ok, the real problem surfaces when you have dynamic table row data of unequal size. There may be overlaps that require a lot of fine-tuning and trial/error.
Therefore, if you wanna write table data to pdf, I’d suggest you think twice if you are choosing reportlib.
2. Create PDF using fpdf:
Now, let’s discuss a relatively simpler way to create pdf. We will use fpdf library to create pdf documents.
Install fpdf:
$pip install fpdf
from fpdf import FPDF

data = [{"a": 1, "b": 2, "c": 3, "d": 4}, {"a": 5, "b": 6, "c": 7, "d": 8}]

def write_table_using_fpdf():

    pdf = FPDF(orientation="landscape", format="a3")
    pdf.add_page()
    pdf.set_font("Times", size=12)

    # set the line height and column width
    line_height = pdf.font_size * 17.5
    col_width = pdf.epw / 5

    for row in data:
        for k, v in row.items():
            print(v)
            pdf.multi_cell(col_width, line_height, str(v), border=1, ln=3, max_line_height=pdf.font_size, align="L")
        pdf.ln(line_height)
    pdf.output(name="pdf_using_fpdf.pdf")


write_table_using_fpdf()
The multi_cell() method is used to create a table in fpdf.
Well, this generates a pretty decent table. However, we may run into the same table data overlap problem if we get dynamic data. You could try with lengthy data for specific columns and check this.
Let’s try again a simpler method that could take dynamic data and transform it into a table in a PDF document.
The best bet to write table data to PDF would be to convert to HTML and then write it to PDF. Trust me, this was the cleanest method I could find.
3. Write table to PDF using pandas, HTML, and pdfkit:
We chose pandas as it has built-in methods to convert a dataframe to HTML. The only task for us is to convert our list of dictionaries into a dataframe.
$pip install pandas
$pip install pdfkit
However, a caveat for this method is you may need wkhtmltopdf for this to work. In macOS, you may install using homebrew.
$brew install wkhtmltopdf
import pdfkit as pdf

data = [{"a": 1, "b": 2, "c": [3,3,3,3,3,3,3,3,3,3,3,3,3,3,3,3,3,3,3,3,3,3,],
         "d": [4,4,4,4,4,4,4,4,4,]},
        {"a": 5, "b": [6,6,6,6,6,6,6,6,6,6], "c":
          [7,7,7,7,7,7,7,7,7,7,7,7,7,7,7], "d": 8}]

def pdf_gen_pdfkit():

        table_headers = [headers.title() for headers in data[0]]

        # extract table data from input data
        table_values = [str(v) for d in data for k, v in d.items()]

        # convert input data to HTML
        a = np.array(table_values)
        # this is required to match your column numbers
        df = pd.DataFrame(a.reshape(-1, len(table_headers)), columns=table_headers)
        # removing the index while writing to html
        html_string = df.to_html(index=False)

        pdf.from_string(html_string, "pdfkit_sample.pdf")

        # sample code to write with css
        #pdf.from_string(html_string, "pdfkit_sample.pdf", css="my_pdf_style.css")

pdf_gen_pdfkit()
As you may see, we have chosen our data to be dynamic and it doesn’t have a consistent structure. Despite this, the output looks pretty decent.
Please note that this is a plain text HTML written to PDF. If at all if you want to add CSS you could very well do that using the css param. I have just shown an example of how to pass a style sheet. However, I have not uploaded any style sheet sample here.
Output:
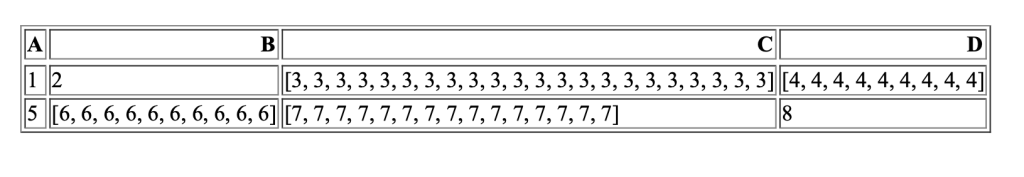
This library would have been my favorite if not for the additional overhead of installing the wkhtmltopdf. Nonetheless, if you don't have any restrictions on installing and you have the permission to install this on a remote server you could very well go with this library.
4. Write as table to PDF using pandas, HTML, and weasyprint:
The final approach we are gonna discuss is the same as approach 3 with one minor difference. Instead of pdfkit we will be using weasyprint to generate the PDF from HTML. The steps are still the same.
$pip install weasyprint
data = [{"a": 1, "b": 2, "c":[3,3,3,3,3,3,3,3,3,3,3,3,3,3,3,3,3,3,3,3,3,3,],
                "d": [4,4,4,4,4,4,4,4,4,]},
        {"a": 5, "b": [6,6,6,6,6,6,6,6,6,6], "c":
          [7,7,7,7,7,7,7,7,7,7,7,7,7,7,7], "d": 8}]

def pdf_gen_weasyprint():

        # extract headers from input data
        table_headers = [headers.title() for headers in data[0]]

        # extract table data from input data
        table_values = [str(v) for d in data for k, v in d.items()]

        # convert input data to HTML
        a = np.array(table_values)
        df = pd.DataFrame(a.reshape(-1, len(table_headers)), columns=table_headers)
        html_string = df.to_html(index=False)

        # write html to pdf
        html_doc = HTML(string=html_string)

        html_doc.write_pdf(f"your_report.pdf", stylesheets=None)

pdf_gen_weasyprint()
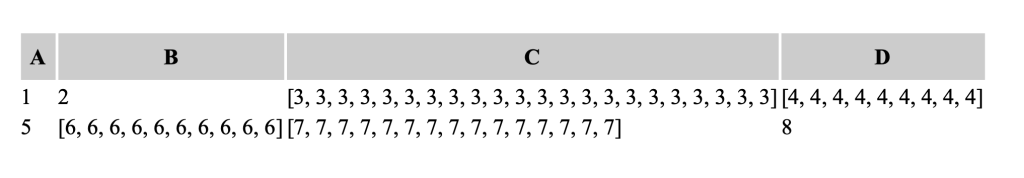
The weasyprint library enables us to generate the PDF from either an HTML string or an HTML file just like pdfkit. However, you don't need any additional installations. Rest assured, the library can generate pretty tables(of course with CSS) without overlap for dynamic structured data.
Output:
Summary:
We have discussed 4 different libraries for generating PDF documents using Python. Of all these the use case determines the approach to generate the document.
-
For plain text data, you could very well get things done quickly using fpdf rather than reportlab. The reason is reportlab is for more advanced users and is way more comprehensive than fpdf.
-
If you have a use case of generating tables in PDF, the best bet is to have an intermediate format and finally write it to pdf so you have more control. In our case, it's an HTML document.
-
For writing table data, you could choose either weasyprint or pdfkit based on whether you have permission to install wkhtmltopdf. Both the libraries almost do the same thing.
References:
-
https://doc.courtbouillon.org/weasyprint/stable/first_steps.html#python-library
-
https://dev.to/bowmanjd/python-pdf-generation-from-html-with-weasyprint-538h
-
https://stackoverflow.com/questions/33155776/export-pandas-dataframe-into-a-pdf-file-using-python
Originally published at https://dock2learn.com on December 17, 2021.
Comments
Loading comments…