Amazon CloudWatch is a monitoring service used by DevOps, Developers, Site Reliability Engineers, and IT managers. We can easily monitor our application and fix issues in production. Logging is a very important part of any application. With proper logging, we can easily track problems and fix the issues before it affects many end users. So, the monitoring log is a very crucial part. In this article, I will configure CloudWatch to monitor the spring boot application log. Let’s begin.
Project setup
Initially, I created a project that will log if we call the API. The API is: {server_path}/aws-demo/api/index (GET api).
Logfile configuration can be found here: https://github.com/olein/Java-AWS-RnD/blob/main/src/main/resources/logback-spring.xml
I need to explain a few things about this file.
<springProfile name="dev | uat | prod">
    <property name="LOGS_FOLDER" value="/home/ec2-user/java-aws-rnd/logs" />
</springProfile>

<springProfile name="uat">
    <property name="FILE_PATH" value="${LOGS_FOLDER}/java-aws-rnd-logging-uat.log" />
</springProfile>

<springProfile name="prod">
    <property name="FILE_PATH" value="${LOGS_FOLDER}/java-aws-rnd-logging-prod.log" />
</springProfile>

<springProfile name="dev">
    <property name="FILE_PATH" value="${LOGS_FOLDER}/java-aws-rnd-logging-dev.log" />
</springProfile>
Here my application will create the log folder in ec2 when we run the application. Based on the profile name SB application will log it in different files. Different log groups will be created in CloudWatch based on this name.
I write a log method to log some random info.
private void log() {
  _LOG_.info("This is a log test at time " + LocalDateTime._now_());
  for (int i = 0; i < 10; i++) {
    _LOG_.info("The number i = " + i);
  }

  try {
    throw new RuntimeException("Some runtime error");
  } catch (Exception e) {
    _LOG_.error(e.getMessage(), e);
  }
}
Project setup is done and I will use maven to build a war.
Configure CloudWatch agent in EC2
First, we need to install the CloudWatch agent in EC2. I already deployed an EC2 instance. Now I will install the CloudWatch agent.
sudo yum install amazon-cloudwatch-agent
CloudWatch agent is installed. Now we need to run it with our config file. amazon-cloudwatch-agent.json
{
  "logs": {
    "logs_collected": {
      "files": {
        "collect_list": [
          {
            "file_path": "/home/ec2-user/java-aws-rnd/logs/*-uat.log",
            "log_group_name": "java-aws-rnd-uat-logging",
            "log_stream_name": "java-aws-rnd-logging-uat-{instance_id}.log",
            "timestamp_format": "%Y-%m-%d %H:%M:%S.%f",
            "multi_line_start_pattern": "{timestamp_format}"
          },
          {
            "file_path": "/home/ec2-user/java-aws-rnd/logs/*-dev.log",
            "log_group_name": "java-aws-rnd-dev-logging",
            "log_stream_name": "java-aws-rnd-logging-dev-{instance_id}.log",
            "timestamp_format": "%Y-%m-%d %H:%M:%S.%f",
            "multi_line_start_pattern": "{timestamp_format}"
          },
          {
            "file_path": "/home/ec2-user/java-aws-rnd/logs/*-prod.log",
            "log_group_name": "java-aws-rnd-prod-logging",
            "log_stream_name": "java-aws-rnd-logging-prod-{instance_id}.log",
            "timestamp_format": "%Y-%m-%d %H:%M:%S.%f",
            "multi_line_start_pattern": "{timestamp_format}"
          }
        ]
      }
    }
  }
}
I uploaded this json file in S3 first and then downloaded it in our /root/config folder.
Now I will execute the following command:
sudo /opt/aws/amazon-cloudwatch-agent/bin/amazon-cloudwatch-agent-ctl -a fetch-config -m ec2 -s -c file:/root/config/amazon-cloudwatch-agent.json
It will start the CloudWatch agent with the given configuration. We can check the status:
sudo /bin/systemctl status amazon-cloudwatch-agent
If the agent is active then the CloudWatch agent is ready to monitor any log is written in this folder: /home/ec2-user/java-aws-rnd/logs. It will send these files to CloudWatch log groups as we configured.
One important thing is if we want to change any configuration in this file, we will need to restart the CloudWatch agent with the same command. It will then reload the configuration.
Now I will install java 11 and upload my war file to EC2 and run it using prod profile
sudo amazon-linux-extras install java-openjdk11
java -jar ./aws-rnd.war --spring.profiles.active=prod
If I call the API I can see the log file is created in folder /home/ec2-user/java-aws-rnd/logs/

Still, my application will not be able to push the log to the CloudWatch log group because it does not have permission. so I will create a role with CloudWatchAgentServerPolicy and assign that role to my EC2 instance. After this setup, my application will start sending logs to the log group.

I ran the application using a prod profile. So, a *-logging-prod.log file was created and that log was pushed to the java-aws-rnd-prod-logging group.
Now I will run the application using a dev profile and a dev group will be created.

These groups are automatically created by AWS. When my application starts sending these logs to that group AWS created the group for us.
Search Log using Logs Insights
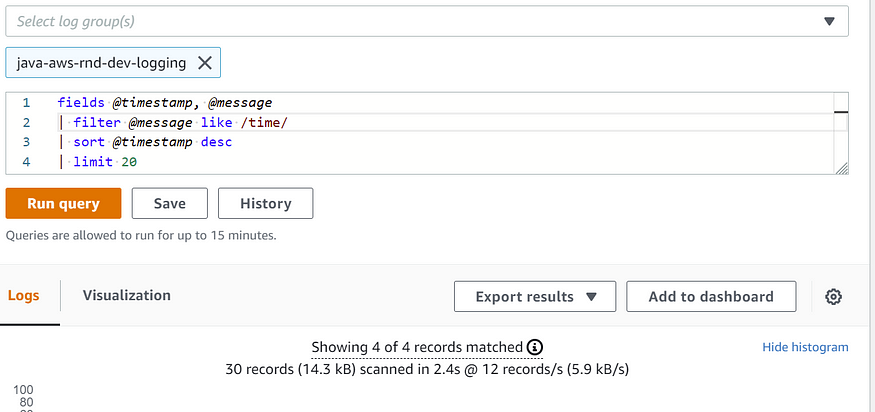
We can search logs using Logs Insights. It is a very useful tool. I will not cover in detail about this tool here but mastering this tool will benefit us.
From the dropdown, we can see the already created log groups.

We need to choose 1 or more log groups to filter or view logs.

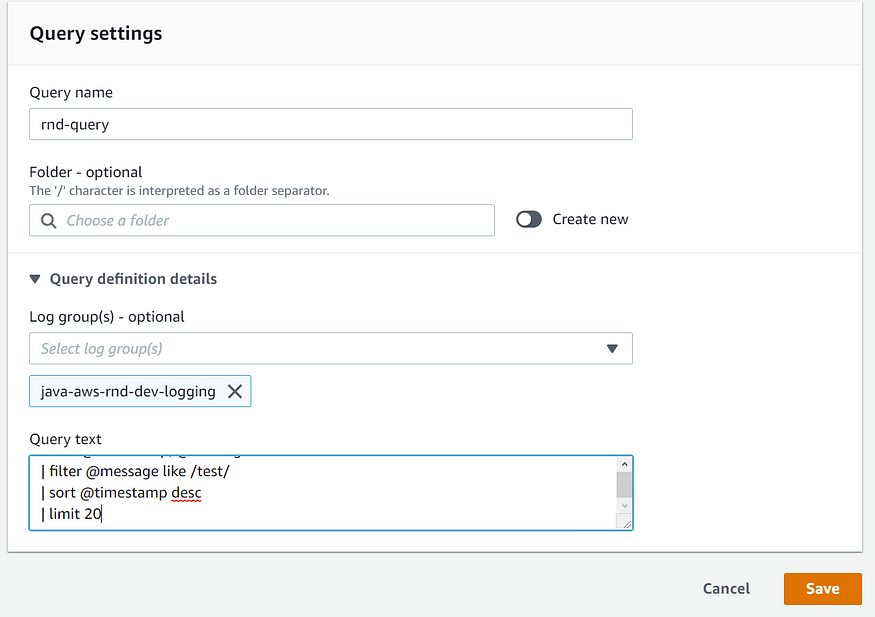
We can also save frequent queries in the Queries section.

Next time we can just select it from the saved queries section and save time to re-write the queries again and again. I hope this will help. Best of luck 😊
Comments
Loading comments…