TL;DR: How to track SERP rankings, title changes, and competitor data Google Trends won’t show. Built with Python, DuckDB, and a CLI-first approach.
Google Trends will tell you if people are searching for “react” or “nextjs”. But it won’t tell you that Stack Overflow just got bumped from position #2 to #7, or that Vercel changed their landing page title five times this month trying to improve click-through rate.
If, say, you’re an indie dev launching a product, needing every edge available, that’s the data that actually matters to you.
So I spent a weekend building a tool to track it. I could’ve just paid for Ahrefs/Semrush etc. But building this taught me:
- How SERP APIs work under the hood
- How to model time-series data in SQL (and its gotchas)
- How to calculate derived metrics (interest score) from raw data
- How DuckDB handles analytical queries
…and also because I didn’t really want to spend anywhere near that much.😅
Ironically, focusing on CLI only made the tool more useful — I can use this, then pipe results to jq, schedule fetches with cron, and script complex workflows without fighting a web framework.
If I want a dashboard later, I can always add FastAPI in about 50 lines. But for now, the CLI is enough. Here’s how I built it.
If you’d like to tinker, the full code to this is on GitHub. Feel free to star, clone, fork, whatever: https://github.com/sixthextinction/duckdb-google-trends-basic/
Why Google Trends Isn’t Enough (And Why SEO Tools Cost $200/Month)
Google Trends answers one question really well: “How many people are searching for X?”
But if you’re building a product, writing technical content, or trying to rank for competitive keywords, you need to answer different questions:
- Which competitors are winning in search results right now?
- When did that tutorial site enter the top 10?
- Is my rank drop because Google reshuffled the entire SERP, or just me?
- What headlines are competitors A/B testing?
Tools like Ahrefs and SEMrush answer these questions. They cost $99–500/month, but I just wanted something I could self-host for the cost of API calls + would be doable as a weekend project.
Why I Use Google Results Volatility as a Proxy for Search Interest
This works because of ONE reason — when search interest in a term rises, Google’s top 10 results become volatile.
“Volatility” here simply means that new domains enter, rankings shift around, sites update their titles and snippets to capture more clicks, etc. You get the picture — essentially, the search engine results page becomes chaotic.
Conversely, when interest in a term is stable or declining, Google’s top 10 ossifies. The same Wikipedia article, the same W3Schools tutorial, the same official docs sit in positions 1–3 for months.
So I don’t really need to track raw search volume (which I can’t have access to — I’m not Google), I can just track these three things:
- New domains entering top 10 because it’s a signal of rising interest or new content opportunities
- Average rank improvement because it’s a signal of SERP instability
- Domain overlap ratio because it measures how many domains persist between snapshots (complementing new domains)
Turns out, if I aggregate these three signals into a single 0–100 score (I’ll talk about the formula in just a bit), I get something that behaves remarkably like Google Trends — but tells me a lot more than just how many are searching.
The System Architecture
The entire system is about 1000 lines of Python and runs locally with no server required.
Here’s how it works:
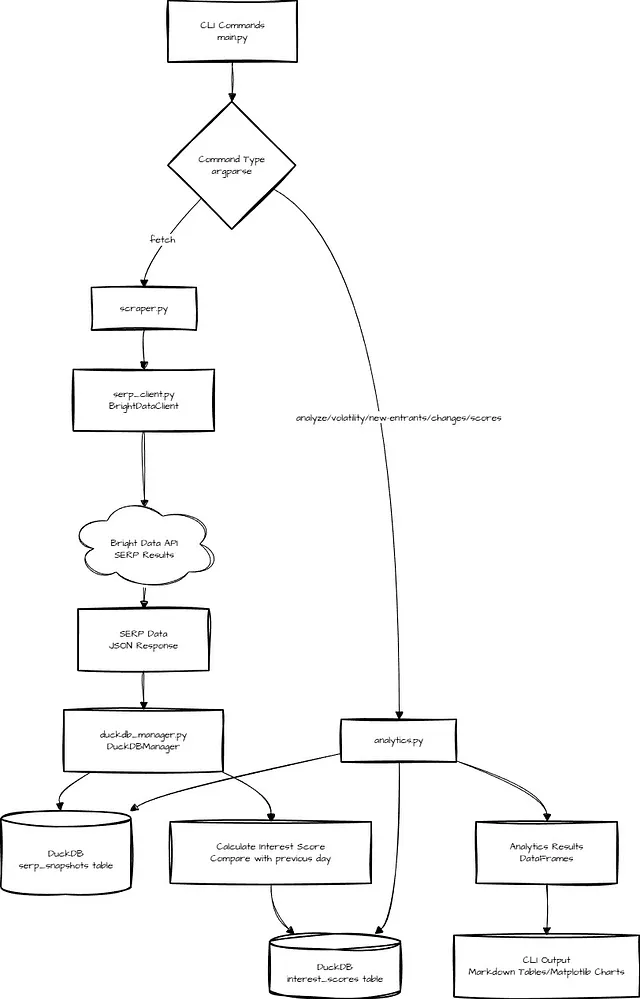
I started small with this one — using only daily snapshots, not live queries. Each run appends point-in-time data instead of overwriting. This way, over 7–30 days, I could build a local historical dataset that I could query freely.
I use DuckDB for this. For this workload (rank comparisons, volatility calculations, detecting new entrants), DuckDB’s SQL engine is ideal.
- It’s columnar, so analytical queries over time-series data are fast. (If you want to know more, I covered columnar formats vs. JSON in this blog post)
- It handles indexing, window functions (LAG(), PARTITION BY — which we will use extensively), and aggregations without needing a server or cloud warehouse.
- It has an in-process design, meaning no separate database server — our project will need just a Python library and a file.
- Plus, since it’s a single file (Our "database” just lives in
data/serp_data.duckdb), backups are trivial and there’s zero configuration overhead.
My Interest Score Formula
Every day, for each keyword, the system calculates a 0–100 “Search Interest Score” based on how much the SERP moved compared to the previous day.
I’m not gonna get into the math, but basically, I did some research on Google Trends scoring, adapted it for my needs, and split my scoring logic into 3 weighted parts:
1. New Domains Entering Top 10 (0–40 points)
new_domains = current_top10 — previous_top10 new_domains_score = min(len(new_domains) * 4, 40)
If 3 new sites enter the top 10, that’s 12 points. If 10 new sites appear (rare but possible during breaking news or major updates), that maxes out at 40 points.
2. Average Rank Improvement (0–30 points)
For each domain that appears in both snapshots
rank_improvement = previous_rank — current_rank
A positive value here means it moved up.
Now, average across all domains, normalized to -10 to +10 range
avg_improvement = mean(rank_improvements) rank_improvement_score = min(max((avg_improvement + 10) / 20 * 30, 0), 30)
If the average site improved by 2 positions, that’s roughly 18 points. If rankings barely moved, this stays close to 15 (neutral).
3. Domain Overlap Ratio (0–30 points)
Finally, how many of today’s top 10 domains also appeared in yesterday’s top 10?
reshuffle_count = count(domains present in both current and previous top 10) reshuffle_frequency = reshuffle_count / max(len(current_domains_set), 1) reshuffle_score = reshuffle_frequency * 30
Let’s say 8 out of 10 domains carry over from yesterday, that’s 24 points. If only 3 carry over (meaning 7 are new — a massive reshuffle), that’s 9 points. This complements the new domains score by capturing continuity.
Total Score
So, taking all three parts together…
interest_score = new_domains_score + rank_improvement_score + reshuffle_score
High scores (60–100) = lots of movement = rising interest or major SERP disruption.
Low scores (0–40) = stable, ossified rankings = same old, same old. Established content is dominant.
What This Looks Like in Practice
I tested this by tracking “nextjs” for 7 days like this.
python main.py scores --query "nextjs" --days 7
Here’s what the output looked like:
=== Interest Scores for 'nextjs' (last 7 days) ===

Found 7 scores:

| snapshot_date | interest_score | new_domains | avg_rank_improvement | reshuffle_freq |
|---------------|----------------|-------------|----------------------|----------------|
| 2026-02-01    | 45.2           | 2           | 1.5                  | 0.6            |
| 2026-02-02    | 52.3           | 3           | 2.1                  | 0.7            |
| 2026-02-03    | 38.7           | 1           | 0.8                  | 0.5            |
| 2026-02-04    | 61.4           | 4           | 3.2                  | 0.8            |
| 2026-02-05    | 42.1           | 2           | 1.2                  | 0.6            |
| 2026-02-06    | 55.8           | 3           | 2.5                  | 0.7            |
| 2026-02-07    | 48.3           | 2           | 1.8                  | 0.6            |

Chart saved to: nextjs_trend.png

Summary: Min: 38.7  Max: 61.4  Avg: 49.1
Here’s that generated chart (I’m using basic matplotlib for these):
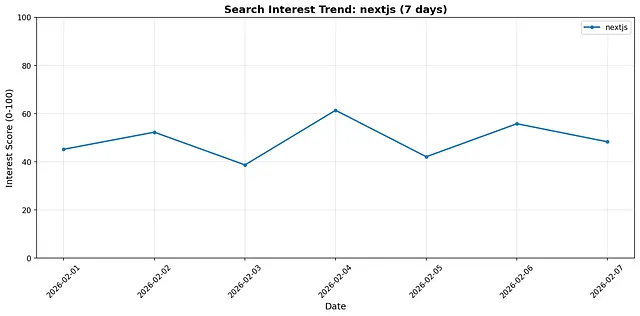
Matplotlib generated Search Interest Trend graph for the term “nextjs”. I tracked this over 7 days in the tool, running once per day.
That spike on Feb 4 (interest_score = 61.4) indicates a major SERP reshuffle — probably a Google algorithm update or a major new tutorial entering the rankings.
Actually Building It
Before diving into the code, here’s the bird’s-eye view of how the system fits together.
The entire project is driven by a small CLI (powered by argparse) in main.py. This file doesn’t contain any scraping or analytics logic — it’s just the orchestration layer that wires everything together.
Read the full code for main.py here: https://github.com/sixthextinction/duckdb-google-trends-basic/blob/main/main.py
You run specific commands (fetch to get SERP data for a keyword, volatility to analyze rank volatility for a keyword over a period of time, scores to view interest scores for a keyword over time, etc.) like so:
python main.py fetch --keywords "python"
python main.py volatility --query "python" --days 30
python main.py scores --query "python" --days 90
The CLI dispatch uses argparse subcommands to wire everything together:
def main():
    parser = argparse.ArgumentParser(description="DuckDB Google Trends")
    subparsers = parser.add_subparsers(dest='command', help='Commands')

    # Each command gets its own parser with relevant arguments
    fetch_parser = subparsers.add_parser('fetch', help='Fetch SERP snapshots')
    fetch_parser.add_argument('--keywords', nargs='+', help='Keywords to track')
    fetch_parser.add_argument('--num-results', type=int, default=10)
    fetch_parser.add_argument('--delay', type=float, default=1.0)

    scores_parser = subparsers.add_parser('scores', help='Show interest scores')
    scores_parser.add_argument('--query', required=True)
    scores_parser.add_argument('--days', type=int, default=90)
    scores_parser.add_argument('--output', type=str)

    # ... similar parsers for analyze, volatility, new-entrants, changes, calculate-scores

    args = parser.parse_args()
    commands = {
        'fetch': cmd_fetch,
        'analyze': cmd_analyze,
        'volatility': cmd_volatility,
        'new-entrants': cmd_new_entrants,
        'changes': cmd_changes,
        'calculate-scores': cmd_calculate_scores,
        'scores': cmd_scores
    }
    commands[args.command](args)
Our main.py defines commands that map directly to the questions we want to ask:
- fetch — collect today’s SERP results for a set of keywords
- analyze — inspect the shape of the collected data
- volatility — measure how rankings change over time
- new-entrants — detect URLs appearing for the first time
- changes — track title and snippet updates
- calculate-scores — recalculate interest scores for existing snapshots
- scores — view the calculated interest score trend
For example, here’s the key command handler for the scores command (the other handlers follow the same pattern):
# Usage: python main.py scores --query "python" --days 90
def cmd_scores(args):
    """Show interest scores for a query"""
    with SERPAnalytics() as analytics:
        result = analytics.interest_scores(args.query, days=args.days)

        print(f"\n=== Interest Scores for '{result['query']}' (last {result['days']} days) ===")
        if len(result['results']) == 0:
            print("No interest scores found")
            print("Note: Interest scores require at least 2 snapshots on different days.")
            print("To calculate scores for existing data, run:")
            print(f"  python main.py calculate-scores --keywords {args.query}")
            return

        print(f"\nFound {len(result['results'])} scores:\n")
        print(df_to_markdown(result['results']))

        # Generate PNG chart
        output_path = args.output or f"{args.query.replace(' ', '_')}_trend.png"
        _generate_png_chart(result['results'], args.query, args.days, output_path)
        print(f"\nChart saved to: {output_path}")
At a high level, what can our project do?
- Fetch daily SERP snapshots for keywords (
fetchcommand) - Store those snapshots locally in DuckDB
- Run analytical queries over historical data using plain old SQL
- When you run
python main.py scores --query “nextjs”, the CLI fetches interest scores from DuckDB and as an added bonus, generates a PNG chart usingmatplotlib. Note that this shows SERP movement, not raw search volume.
We don’t need servers, background workers, or dashboards here.
Now that we know how this tool works, let’s look at the major modules that make all this happen.
Module 1: Fetching SERP Data
All external data access is isolated in serp_client.py. I only have access to one SERP API — Bright Data — so I’ll only have to implement one class. Get your credentials here.
This approach does make it easy to extend it with other SERP APIs: just write another client, and include its credentials in your env file.
` Read the full code for serp_client.py here: https://github.com/sixthextinction/duckdb-google-trends-basic/blob/main/src/serp_client.py
"""
Bright Data SERP API client
"""

import os
import json
import requests
from typing import Dict, Any, Optional
from dotenv import load_dotenv

load_dotenv()


class BrightDataClient:
    """Client for Bright Data SERP API"""

    def __init__( self,
        api_key: Optional[str] = None,
        zone: Optional[str] = None,
        country: Optional[str] = None ):
        env_api_key = os.getenv("BRIGHT_DATA_API_KEY")
        env_zone = os.getenv("BRIGHT_DATA_ZONE")
        env_country = os.getenv("BRIGHT_DATA_COUNTRY")

        self.api_key = api_key or env_api_key
        self.zone = zone or env_zone
        self.country = country or env_country
        self.api_endpoint = "https://api.brightdata.com/request"

        if not self.api_key:
            raise ValueError(
                "BRIGHT_DATA_API_KEY must be provided via constructor or environment variable"
            )

        if not self.zone:
            raise ValueError(
                "BRIGHT_DATA_ZONE must be provided via constructor or environment variable"
            )

        self.session = requests.Session()
        self.session.headers.update({
            'Content-Type': 'application/json',
            'Authorization': f'Bearer {self.api_key}'
        })

    def search( self,
        query: str,
        num_results: int = 10,
        language: Optional[str] = None,
        country: Optional[str] = None ) -> Dict[str, Any]:
        """Execute a Google search via Bright Data SERP API"""
        search_url = (
            f"https://www.google.com/search"
            f"?q={requests.utils.quote(query)}"
            f"&num={num_results}"
            f"&brd_json=1"
        )

        if language:
            search_url += f"&hl={language}&lr=lang_{language}"

        target_country = country or self.country

        payload = {
            'zone': self.zone,
            'url': search_url,
            'format': 'json'
        }

        if target_country:
            payload['country'] = target_country

        try:
            response = self.session.post(
                self.api_endpoint,
                json=payload,
                timeout=30
            )
            response.raise_for_status()
            result = response.json()

            # Parse body JSON string if present
            if isinstance(result, dict) and 'body' in result:
                if isinstance(result['body'], str):
                    result['body'] = json.loads(result['body'])
                # Return the parsed body content
                return result['body']

            return result

        except requests.exceptions.HTTPError as e:
            error_msg = f"Search request failed with HTTP {e.response.status_code}"
            if e.response.text:
                error_msg += f": {e.response.text[:200]}"
            raise RuntimeError(error_msg) from e
        except requests.exceptions.RequestException as e:
            raise RuntimeError(f"Search request failed: {e}") from e
This is just a thin wrapper around the Bright Data API. It takes a query, returns JSON with organic search results (title, snippet, URL, rank).
This module is called when we run the fetch command.
python main.py fetch --keywords "python" "javascript" "react"
This will connect to the Bright Data SERP API, and for each keyword, fetch Google search results (default of 10 per keyword, adjust as necessary), and extract + store organic results (title, snippet, URL, rank). Remember, interest scores require at least 2 snapshots on different days. You should fetch snapshots daily to build historical trends (cron job, or just running manually.)
Example output:
Fetching snapshots for 3 keywords…
[1/3] 'python': 10 results
[2/3] 'javascript': 10 results
[3/3] 'react': 10 results
Total snapshots in database: 30
Module 2: Storing Snapshots in DuckDB
Once SERP data is fetched by the previous module, it needs to be stored in DuckDB for analytical queries. That logic lives in duckdb_manager.py
Read the full code for duckdb_manager.py here: https://github.com/sixthextinction/duckdb-google-trends-basic/blob/main/src/duckdb_manager.py
First of all, let’s introduce the schema we’ll be using:
CREATE TABLE IF NOT EXISTS serp_snapshots (
    snapshot_id BIGINT PRIMARY KEY,
    query TEXT NOT NULL,
    snapshot_date DATE NOT NULL,
    snapshot_timestamp TIMESTAMP NOT NULL,
    url TEXT NOT NULL,
    title TEXT,
    snippet TEXT,
    domain TEXT,
    rank INTEGER NOT NULL,
    UNIQUE(query, snapshot_date, url)
)

-- Interest scores table (calculated from SERP movement between snapshots)
CREATE TABLE IF NOT EXISTS interest_scores (
    query TEXT NOT NULL,
    snapshot_date DATE NOT NULL,
    interest_score DOUBLE NOT NULL,
    new_domains_count INTEGER,
    avg_rank_improvement DOUBLE,
    reshuffle_frequency DOUBLE,
    UNIQUE(query, snapshot_date)
)

-- Indexes for fast queries
CREATE INDEX IF NOT EXISTS idx_query_date ON serp_snapshots(query, snapshot_date)
CREATE INDEX IF NOT EXISTS idx_url_query ON serp_snapshots(url, query)
CREATE INDEX IF NOT EXISTS idx_interest_scores ON interest_scores(query, snapshot_date)
Each SERP result becomes a row, keyed by (query, date, URL). Interest scores are stored in a separate table, calculated automatically when a new snapshot is inserted. So, inserting a snapshot will look like this:
def insert_snapshot(self, results: List[Dict[str, Any]], query: str,
                   snapshot_date: Optional[datetime] = None):
    """Insert a daily snapshot of SERP results"""
    if snapshot_date is None:
        snapshot_date = datetime.now()

    snapshot_timestamp = snapshot_date
    snapshot_date_only = snapshot_date.date() if hasattr(snapshot_date, 'date') else snapshot_date

    if not results:
        return

    def extract_domain(url: str) -> str:
        """Extract domain from URL, stripping www prefix"""
        if not url:
            return ""
        try:
            from urllib.parse import urlparse
            parsed = urlparse(url)
            return parsed.netloc.replace("www.", "")
        except:
            return ""

    # Get max snapshot_id
    max_id_result = self.conn.execute(
        "SELECT COALESCE(MAX(snapshot_id), 0) FROM serp_snapshots"
    ).fetchone()
    next_id = (max_id_result[0] if max_id_result else 0) + 1

    rows = []
    for idx, result in enumerate(results):
        url = result.get('url', result.get('link', ''))
        domain = extract_domain(url)
        rows.append({
            'snapshot_id': next_id + idx,
            'query': query,
            'snapshot_date': snapshot_date_only,
            'snapshot_timestamp': snapshot_timestamp,
            'url': url,
            'title': result.get('title', ''),
            'snippet': result.get('snippet', result.get('description', '')),
            'domain': domain,
            'rank': idx + 1
        })

    import pandas as pd
    df = pd.DataFrame(rows)
    self.conn.execute("""
        INSERT OR IGNORE INTO serp_snapshots
        SELECT * FROM df
    """)
    # Calculate and store interest score
    self._calculate_interest_score(query, snapshot_date_only)
Instead of updating rows, every run adds new records. This builds a local time-series dataset.
Here’s how we calculate the interest score using that 40–30–30 formula described earlier:
def _calculate_interest_score(self, query: str, snapshot_date):
    """Calculate Search Interest Score (0-100) based on SERP movement"""
    # Get previous day's snapshot for comparison
    prev_date_result = self.conn.execute("""
        SELECT MAX(snapshot_date)
        FROM serp_snapshots
        WHERE query = ?
          AND snapshot_date `< ?
    """, [query, snapshot_date]).fetchone()

    if not prev_date_result or not prev_date_result[0]:
        # First snapshot, no comparison possible
        return

    prev_date = prev_date_result[0]

    # Get current top 10 domains
    current_domains = self.conn.execute("""
        SELECT DISTINCT domain
        FROM serp_snapshots
        WHERE query = ?
          AND snapshot_date = ?
          AND rank <= 10
    """, [query, snapshot_date]).fetchall()
    current_domains_set = {row[0] for row in current_domains}

    # Get previous top 10 domains
    prev_domains = self.conn.execute("""
        SELECT DISTINCT domain
        FROM serp_snapshots
        WHERE query = ?
          AND snapshot_date = ?
          AND rank <= 10
    """, [query, prev_date]).fetchall()
    prev_domains_set = {row[0] for row in prev_domains}

    # Count new domains entering top 10
    new_domains = current_domains_set - prev_domains_set
    new_domains_count = len(new_domains)

    # Calculate average rank improvement for existing domains
    rank_changes = self.conn.execute("""
        WITH current_ranks AS (
            SELECT domain, rank
            FROM serp_snapshots
            WHERE query = ? AND snapshot_date = ?
              AND rank <= 10
        ),
        prev_ranks AS (
            SELECT domain, rank
            FROM serp_snapshots
            WHERE query = ? AND snapshot_date = ?
              AND rank <= 10
        )
        SELECT
            c.domain,
            c.rank as current_rank,
            p.rank as prev_rank,
            (p.rank - c.rank) as rank_improvement
        FROM current_ranks c
        JOIN prev_ranks p ON c.domain = p.domain
    """, [query, snapshot_date, query, prev_date]).fetchall()

    if rank_changes:
        avg_rank_improvement = sum(row[3] for row in rank_changes) / len(rank_changes)
    else:
        avg_rank_improvement = 0.0

    # Calculate reshuffle frequency (how many domains changed position)
    reshuffle_count = len(rank_changes)
    reshuffle_frequency = reshuffle_count / max(len(current_domains_set), 1)

    # Normalize to 0-100 score
    # I'm calculating a final score from 3 weighted sub-scores:
    # - New domains: 0-10 domains = 0-40 points
    # - Rank improvement: -10 to +10 = 0-30 points (normalized)
    # - Reshuffle frequency: 0-1 = 0-30 points

    new_domains_score = min(new_domains_count * 4, 40)  # Max 40 points
    rank_improvement_score = min(max((avg_rank_improvement + 10) / 20 * 30, 0), 30)  # Max 30 points
    reshuffle_score = reshuffle_frequency * 30  # Max 30 points

    interest_score = new_domains_score + rank_improvement_score + reshuffle_score

    # Store interest score
    self.conn.execute("""
        INSERT OR REPLACE INTO interest_scores
        (query, snapshot_date, interest_score, new_domains_count, avg_rank_improvement, reshuffle_frequency)
        VALUES (?, ?, ?, ?, ?, ?)
    """, [query, snapshot_date, interest_score, new_domains_count, avg_rank_improvement, reshuffle_frequency])
This runs automatically every time a new snapshot is inserted. The score gets stored in a separate interest_scores table for easy querying.
Module 3: Analytical Queries
The nerdiest of our logic lives in analytics.py. This module opens DuckDB in read-only mode and exposes focused queries.
` Read the full code for analytics.py here: https://github.com/sixthextinction/duckdb-google-trends-basic/blob/main/src/analytics.py
A good analytical query to demonstrate right now would be the one for rank volatility:
def rank_volatility(self, query: str, days: int = 30) -> Dict[str, Any]:
    """Calculate rank volatility for URLs over time"""
    cutoff_date = datetime.now().date() - timedelta(days=days)

    result = self.conn.execute("""
        WITH rank_changes AS (
            SELECT
                url,
                domain,
                rank,
                snapshot_date,
                LAG(rank) OVER (PARTITION BY url ORDER BY snapshot_date) as prev_rank
            FROM serp_snapshots
            WHERE query = ? AND snapshot_date >= ?
            ORDER BY url, snapshot_date
        ),
        volatility AS (
            SELECT
                url,
                domain,
                COUNT(*) as snapshot_count,
                AVG(rank) as avg_rank,
                MIN(rank) as best_rank,
                MAX(rank) as worst_rank,
                STDDEV(rank) as rank_stddev,
                COUNT(CASE WHEN prev_rank IS NOT NULL AND rank != prev_rank THEN 1 END) as rank_changes
            FROM rank_changes
            GROUP BY url, domain
        )
        SELECT
            url,
            domain,
            snapshot_count,
            ROUND(avg_rank, 2) as avg_rank,
            best_rank,
            worst_rank,
            ROUND(rank_stddev, 2) as rank_stddev,
            rank_changes,
            ROUND(CAST(rank_changes AS DOUBLE) / NULLIF(snapshot_count - 1, 0) * 100, 1) as volatility_pct
        FROM volatility
        WHERE snapshot_count > 1
        ORDER BY rank_stddev DESC, avg_rank ASC
        LIMIT 50
    """, [query, cutoff_date]).df()

    return {'query': query, 'days': days, 'results': result}
This uses window functions (LAG) and aggregations (STDDEV) to surface URLs that move around the most. These queries would normally require a data warehouse — here they’re just SQL running locally.
Run this with:
python main.py volatility --query "python" --days 30
This, for example, will analyze the last 30 days of snapshots for the query string “python”, calculating average rank, best/worst rank, standard deviation, and change frequency — and display the top 50 (as default) most volatile URLs.
Example output:
=== Rank Volatility for 'python' (last 30 days) ===

Top 10 most volatile URLs:

| url | domain | snapshot_count | avg_rank | best_rank | worst_rank | rank_stddev | rank_changes | volatility_pct |
| --- | --- | --- | --- | --- | --- | --- | --- | --- |
| https://www.python.org/ | python.org | 30 | 1.5 | 1 | 3 | 0.67 | 15 | 51.7 |
| https://www.w3schools.com/python/ | w3schools.com | 30 | 2.3 | 1 | 5 | 1.12 | 18 | 62.1 |
| https://en.wikipedia.org/wiki/Python_(programming_language) | wikipedia.org | 28 | 4.1 | 2 | 8 | 1.89 | 12 | 44.4 |
| https://www.codecademy.com/catalog/language/python | codecademy.com | 25 | 5.2 | 3 | 10 | 2.15 | 10 | 41.7 |
Another query that is very useful is finding new entrants:
def new_entrants(self, query: str, days: int = 7):
    """Find URLs that appeared for the first time recently"""
    cutoff_date = datetime.now().date() - timedelta(days=days)

    result = self.conn.execute("""
        WITH first_appearance AS (
            SELECT
                url,
                domain,
                MIN(snapshot_date) as first_seen
            FROM serp_snapshots
            WHERE query = ?
            GROUP BY url, domain
        ),
        recent_entrants AS (
            SELECT
                fa.url,
                fa.domain,
                fa.first_seen,
                s.rank as first_rank,
                s.title,
                s.snippet
            FROM first_appearance fa
            JOIN serp_snapshots s
                ON fa.url = s.url
                AND fa.first_seen = s.snapshot_date
                AND s.query = ?
            WHERE fa.first_seen >= ?
        )
        SELECT
            url,
            domain,
            first_seen,
            first_rank,
            title,
            snippet
        FROM recent_entrants
        ORDER BY first_seen DESC, first_rank ASC
        LIMIT 50
    """, [query, query, cutoff_date]).df()

    return {'query': query, 'days': days, 'results': result}
This finds URLs whose first appearance falls within the last N days — perfect for spotting new competitors or fresh content entering the rankings.
Run this with:
python main.py new-entrants --query "python" --days 7
Example output:
=== New Entrants for 'python' (last 7 days) ===

Found 3 new URLs:

| url | domain | first_seen | first_rank | title | snippet |
| --- | --- | --- | --- | --- | --- |
| https://realpython.com/ | realpython.com | 2026-02-04 | 7 | Real Python - Python Tutorials | Learn Python programming with Real Python's comprehensive tutorials and courses... |
| https://www.pythonforbeginners.com/ | pythonforbeginners.com | 2026-02-05 | 9 | Python For Beginners | A comprehensive guide to learning Python programming from scratch... |
| https://docs.python-guide.org/ | docs.python-guide.org | 2026-02-06 | 8 | The Hitchhiker's Guide to Python | Best practices and recommendations for Python development... |
I’m not going to go over every module, but it’s all in the code. Find all queries + their expected output in the project README.md.
Module 4: The Snapshot Fetcher
Finally, scraper.py (I’m so sorry — I really could have named this better 😅) connects ingestion and storage.
Read the full code for scraper.py here: https://github.com/sixthextinction/duckdb-google-trends-basic/blob/main/src/scraper.py
"""
SERP snapshot fetcher
"""

import time
from datetime import datetime
from typing import List, Optional

from serp_client import BrightDataClient
from duckdb_manager import DuckDBManager


def fetch_snapshots(keywords: List[str], num_results: int = 10, delay: float = 1.0):
    """
    Fetch SERP snapshots for keywords and store in DuckDB

    Args:
        keywords: List of search keywords
        num_results: Number of results per keyword
        delay: Delay between API calls (seconds)
    """
    client = BrightDataClient()

    with DuckDBManager() as db:
        print(f"Fetching snapshots for {len(keywords)} keywords...")

        for idx, keyword in enumerate(keywords):
            try:
                # Fetch SERP results
                serp_data = client.search(keyword, num_results=num_results)

                # Extract organic results
                organic_results = []
                if isinstance(serp_data, dict) and 'organic' in serp_data:
                    organic_results = serp_data['organic']

                if organic_results:
                    # Insert snapshot
                    db.insert_snapshot(organic_results, keyword)
                    print(f"[{idx+1}/{len(keywords)}] '{keyword}': {len(organic_results)} results")
                else:
                    print(f"[{idx+1}/{len(keywords)}] '{keyword}': No results found")

                # Rate limiting
                if idx < len(keywords) - 1:
                    time.sleep(delay)

            except Exception as e:
                print(f"Error fetching '{keyword}': {e}")
                continue

        total = db.get_snapshot_count()
        print(f"\nTotal snapshots in database: {total}")
This is just simple orchestration logic, again. It iterates over keywords, fetches results, and inserts snapshots. Rate limiting and error handling live at the edges. I’ve kept the core logic deliberately simple.
That’s everything! Remember, main.py brings all of these together.
Real World Use Cases
Now that you understand how it works, here’s some cool things you can actually do with this tool.
1. Detect Google Algorithm Updates Before They’re Announced
When tracking multiple keywords in the same niche, sudden volatility spikes across all of them indicate an algorithm change.
python main.py volatility --query "react" --days 7
python main.py volatility --query "vue" --days 7
python main.py volatility --query "angular" --days 7
If all three show high rank_stddev and volatility_pct, Google likely pushed an update.
SEO folks pay $200/month for SEMrush Sensor just to get this signal. You’re building it for the cost of SERP API calls.
2. Spy on Competitor SEO Tactics
Track title and snippet changes to see what competitors are A/B testing:
python main.py changes --query "nextjs tutorial" --days 30
Example output:
| url                              | prev_title                    | new_title                                               |
|----------------------------------|-------------------------------|---------------------------------------------------------|
| https://nextjs.org/docs          | Next.js Documentation         | Next.js Docs | Next.js                                  |
| https://nextjs.org/learn         | Learn Next.js                 | Learn Next.js | Next.js by Vercel - The React Framework |
Let’s say a site changed their title from a generic page description to something more specific. If their rank improved after the change, that’s a signal the new title performs better — steal that pattern!
3. Find Content Gaps in Real-Time
See which sites are entering top 10 and what format they’re using:
python main.py new-entrants --query "react hooks tutorial" --days 7
Example output:
| domain              | first_seen | first_rank | title                                    |
|---------------------|------------|------------|------------------------------------------|
| react-tutorial.dev  | 2026-02-05 | 7          | React Hooks Interactive Tutorial         |
| codesandbox.io      | 2026-02-06 | 9          | Learn React Hooks - Live Coding Examples |
Let’s say there are two new entrants in the SERP for the query “react hooks tutorial”, and both new entrants have “Interactive” or “Live” in their titles. That means Google is currently rewarding interactive content for this query. Adjust your content strategy accordingly.
4. Validate Content Ideas Before Creation
This one’s super simple to understand. High volatility = easier for you to rank. Low volatility = established players dominate.
python main.py volatility --query "python tutorial" --days 30
python main.py volatility --query "rust async tutorial" --days 30
Let’s say the query “python tutorial” shows rank_stddev: 0.3 (very stable) and “rust async tutorial” shows rank_stddev: 2.1 (chaotic), focus on the Rust content! The Python keyword is locked down by W3Schools and Real Python — you won’t break in easily.
5. Track Your Own Product’s SERP Performance
Monitor how your product ranks for target keywords:
python main.py fetch --keywords "whatever your product is or does"
Then check if you’re entering top 10:
python main.py new-entrants --query "whatever your product is or does" --days 7
If your product URL appears, congrats — you just entered the top 10. If competitors are dropping out (volatility shows their ranks declining), you’re winning.
What I Learned Building This
- DuckDB is a total cheat code for embedded analytics. I expected to need PostgreSQL (or ClickHouse, ugh.) for time-series queries over SERP data. Without fiddling with any config, calculating rank volatility across 30 days of snapshots for 50 URLs ran in ~20ms for me. The database file was less than 5MB for weeks of data.
- Bright Data’s SERP API is very reliable. I tried other SERP APIs before settling on Bright Data, primarily because of the consistent JSON output for Google and Bing, and support for DuckDuckGo, Yandex, etc. This experiment cost me pennies — but make sure you check their pricing so you don’t get burnt by costs you shouldn’t be incurring.
- The Interest Score formula needs tuning, possibly. The 40/30/30 weighting (new domains / rank improvement / domain overlap ratio) was only my first guess. It works reasonably well, but it’s not perfect. At the very least, I should weight new domains more heavily for breaking news queries, and reduce domain overlap ratio impact for stable niches (Because, for example, Wikipedia will always be #1 for “Python programming language”)
Try It Yourself
Again, the full code is on GitHub: https://github.com/sixthextinction/duckdb-google-trends-basic
Quick start:
git clone https://github.com/sixthextinction/duckdb-google-trends-basic.git
# or...
gh repo clone sixthextinction/duckdb-google-trends-basic
# then...
cd duckdb-google-trends-basic
pip install -r requirements.txt

# Set environment variables
export BRIGHT_DATA_API_KEY="your_key"
export BRIGHT_DATA_ZONE="your_zone"
export BRIGHT_DATA_COUNTRY="us"  # optional, for geo-targeted results

# Or use a .env file instead (python-dotenv is included)

# Test with sample data (no API key needed)
python seed_data.py
python main.py scores --query "nextjs" --days 7

# Or fetch real data
python main.py fetch --keywords "react" "vue" "svelte"
I’ve included a seed script that creates 7 days of synthetic data so you can test immediately without waiting. Otherwise, set up a daily cron job to fetch snapshots automatically, and within a week you’ll have real trend data.
Thanks for reading!
Hi 👋 I’m constantly tinkering with dev tools, running weird-ass experiments, and otherwise building/deep-diving stuff that probably shouldn’t work but does — and writing about it. I put out a new post every Monday/Tuesday. If you’re into offbeat experiments and dev tools that actually don’t suck, give me a follow.
If you did something cool with this tool, I’d love to see it. Reach out on LinkedIn, or put it in the comments below.
Comments
Loading comments…