The ChatGPT model is a large language model trained by OpenAI that is capable of generating human-like text. By providing it with a prompt, it can generate responses that continue the conversation or expand on the given prompt.

In this article, I have compiled various data science prompts that can be used with ChatGPT. To get started, simply use the prompts below as input for ChatGPT. Replace everything in [squarebrackets] with your own to achieve results specific to your use case.
1. Train Classification Model
I want you to act as a data scientist and code for me. I have a dataset of
[describe dataset]. Please build a machine learning model that predict[target variable].
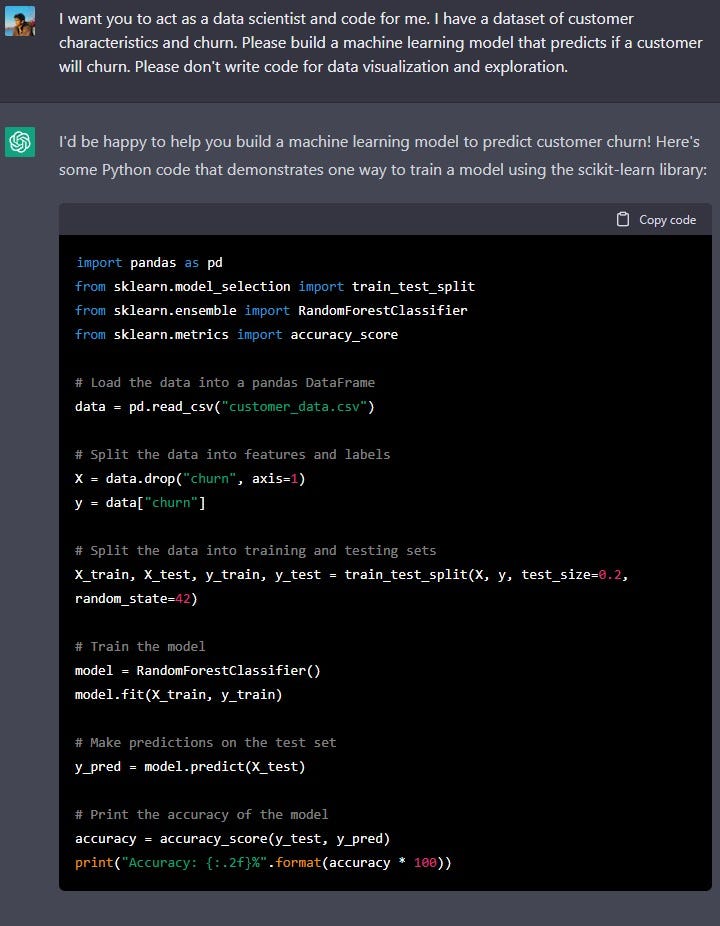
This code assumes that your data is in a CSV file "customer_data.csv", and that the last column is the label "churn". The code uses a random forest classifier to train the model, but you can experiment with other algorithms as well. The code also uses the accuracy score as a metric for evaluating the model, but you may use another evaluation metrics to.
2. Automatic Machine Learning
I want you to act as an automatic machine learning (AutoML) bot using TPOT for me. I am working on a model that predicts
[...]. Please write python code to find the best classification model with the highest AUC score on the test set.
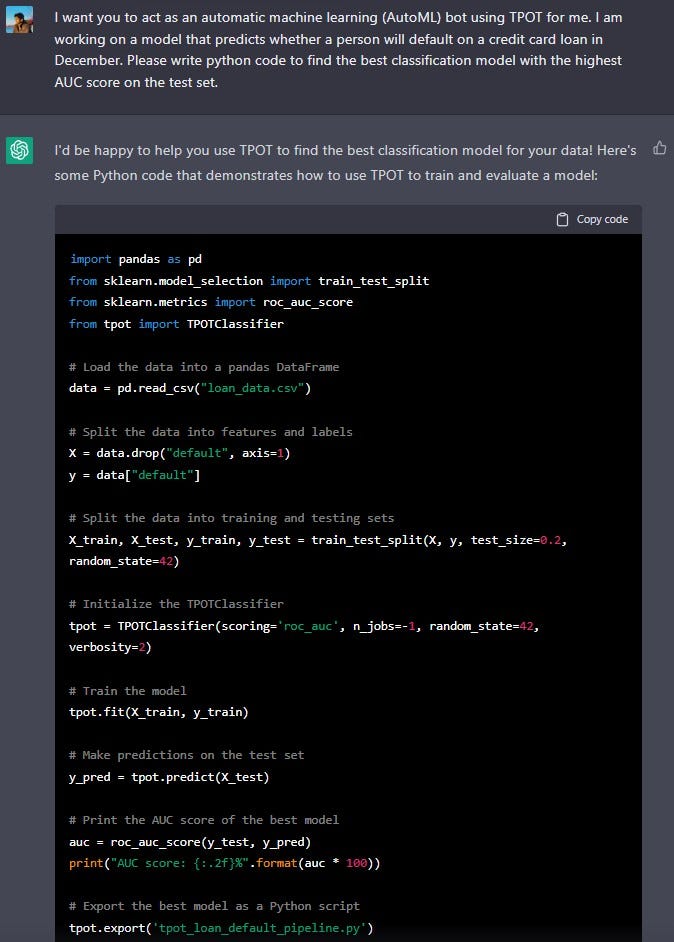
This code assumes that your data is in a CSV file called "loan_data.csv", and that the last column is the label "default". The code uses TPOT to automatically search for the best model, using the AUC score as the evaluation metric. Once the model is trained, the code makes predictions on the test set and prints the AUC score of the best model. The code also export the best pipeline as a python script 'tpot_loan_default_pipeline.py'.
Please note that depending on your data and the complexity of your problem, the training process can take a long time, sometimes hours or even days.
3. Tune Hyperparameter
I want you to act as a data scientist and code for me. I have trained a
[model name]. Please write the code to tune the hyper parameters.
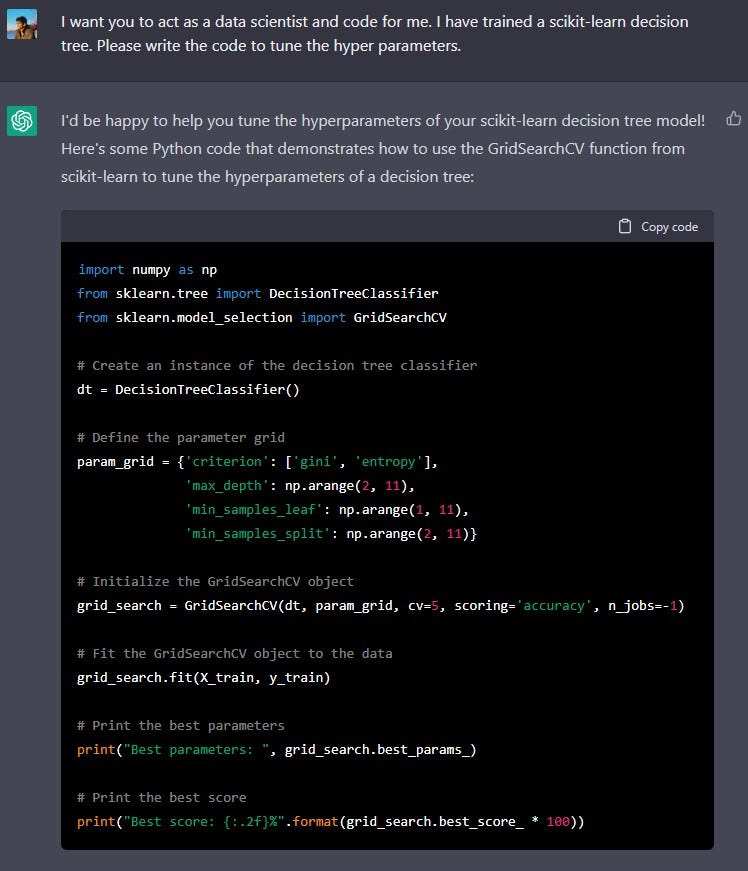
The above code creates an instance of the decision tree classifier, then defines a grid of hyperparameters to search over. The grid includes different values for the 'criterion' , 'max_depth', 'min_samples_leaf' and 'min_samples_split' hyperparameters. The grid_search object is then initialized with 5-fold cross validation and accuracy scoring. Then it fits the grid_search object to the data and finds the best parameters and best score of the decision tree model.
Please note that the code above is just an example and you should adjust the parameter grid according to your data and the problem you are trying to solve.
4. Explore Data
I want you to act as a data scientist and code for me. I have a dataset of [describe dataset]. Please write code for data visualization and exploration.
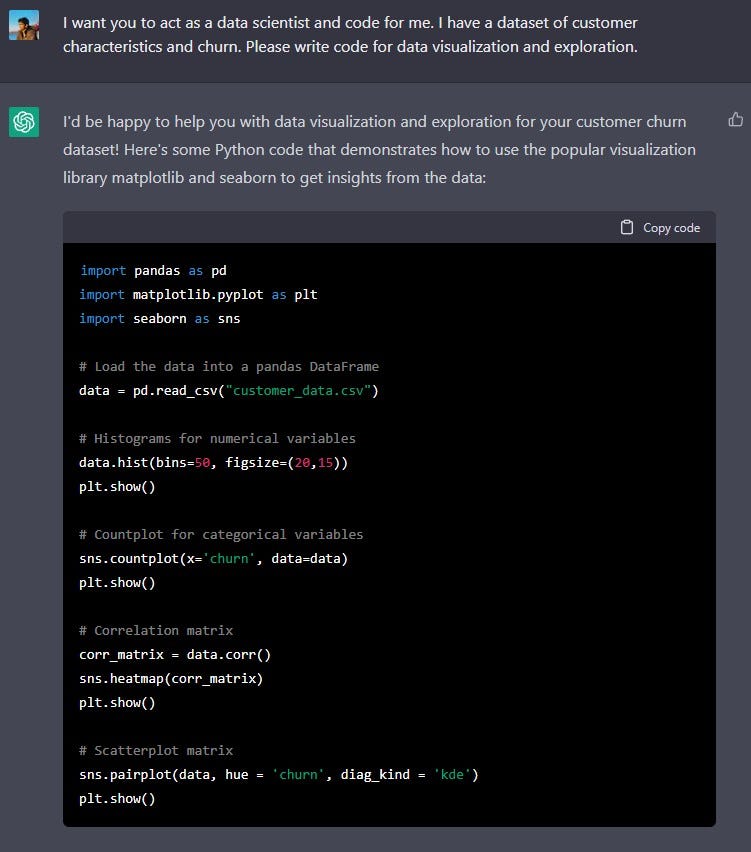
This code loads the customer data into a pandas DataFrame and then creates different types of visualizations to get insights from the data.
- Histograms for all numerical variables, to check the distribution of each variable.
- Countplot for 'churn' variable, to see the distribution of customers who churned and who didn't.
- Correlation matrix, to see which features are highly correlated with each other.
- Scatterplot matrix, to visualize the relationship between features and target variable.
You can also try other types of visualizations like boxplots, violin plots, etc. depending on your data and the type of variable.
5. Generate Data
I want you to act as a fake data generator. I need a dataset that has x rows and y columns: [insert column names].
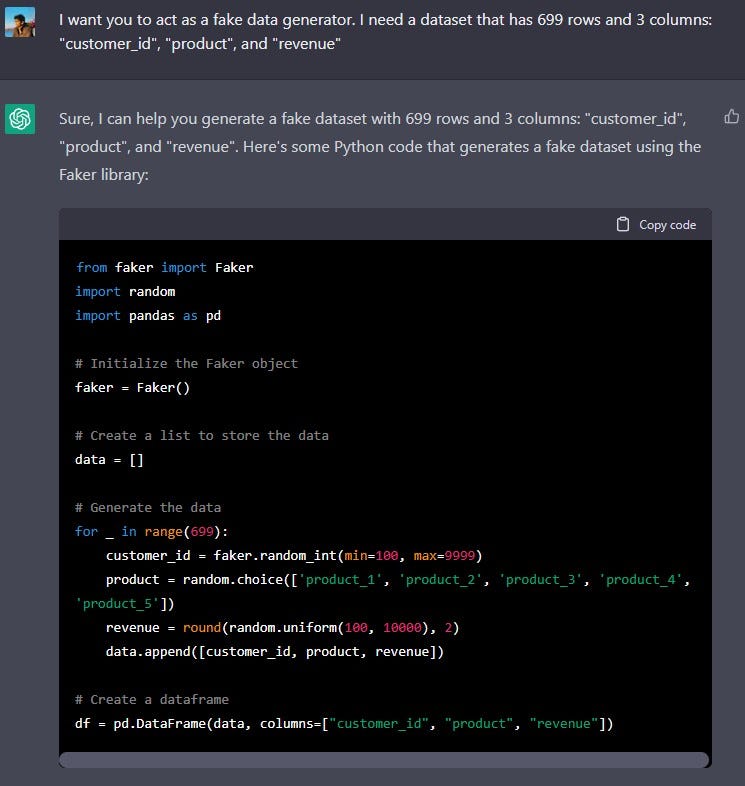
This code uses the Faker library to generate random customer ids, product names, and revenue values. The product names are selected randomly among five predefined options. The revenue is generated as a random float between 100 and 10000 rounded to two decimal points. The data is then stored in a list of lists and then it's transformed into a pandas dataframe using the pandas DataFrame constructor.
Please keep in mind that this data is purely synthetic and does not reflect real-world data distribution.
6. Write Regex
I want you to act as a coder. Please write me a regex in python that [describe regex]
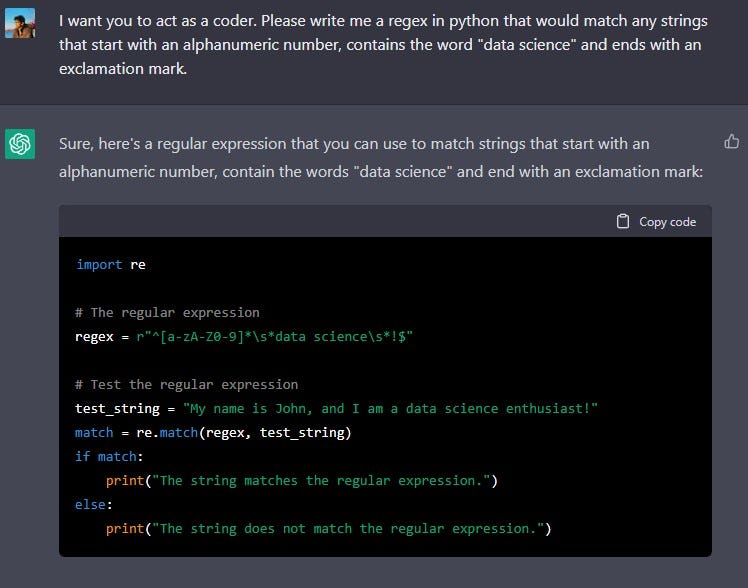
This regular expression is composed of several parts:
^matches the start of a line[a-zA-Z0-9]*matches any number of alphanumeric characters at the start of the string, it may be zero or more.\s*matches any number of white spaces, it may be zero or more.data sciencematches the string "data science"\s*matches any number of white spaces, it may be zero or more.!matches the exclamation mark character$matches the end of the line
Please note that the regular expression assumes that the string you want to match contains only one occurrence of "data science" and only one exclamation mark. If you want to match multiple occurrences of "data science" or multiple exclamation marks, you will need to modify the regular expression accordingly.
7. Train Time Series
I want you to act as a data scientist and code for me. I have a time series dataset [describe dataset]. Please build a machine learning model that predict [target variable]. Please use [time range] as train and [time range] as validation.
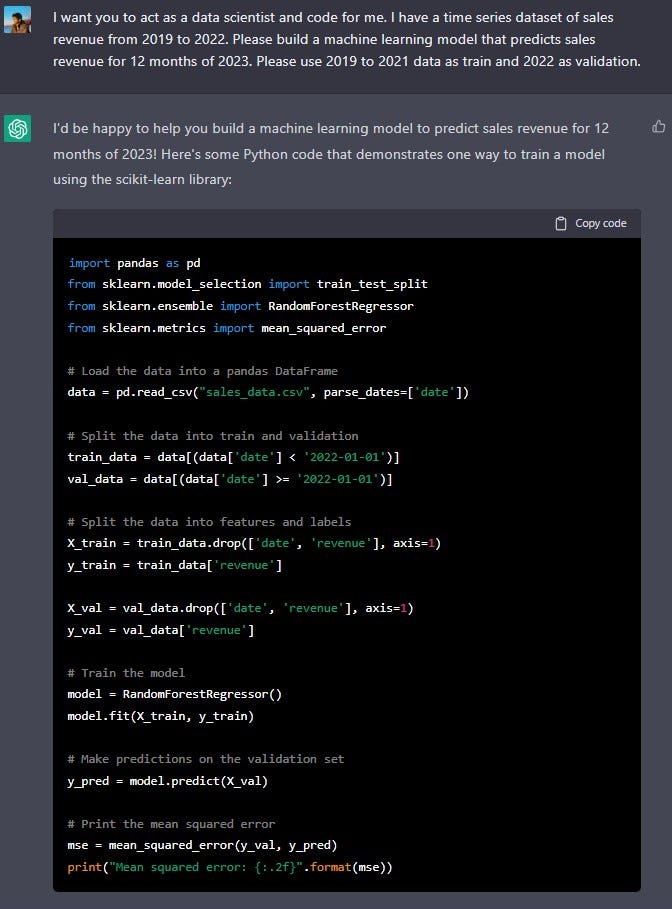
This code assumes that your data is in a CSV file called "sales_data.csv" with date and revenue as columns. The code uses RandomForestRegressor to train the model, but you can experiment with other algorithms as well. The code also uses the mean squared error as a metric for evaluating the model, but you may use another evaluation metrics to. The code assumes that you have the date column in the dataset, and it split the dataset into two parts: train data (2019 to 2021) and validation data (2022)
8. Address Imbalance Data
I want you to act as a coder. I have trained a machine learning model on an imbalanced dataset. The predictor variable is the column [Insert column name]. In python, how do I oversample and/or undersample my data?
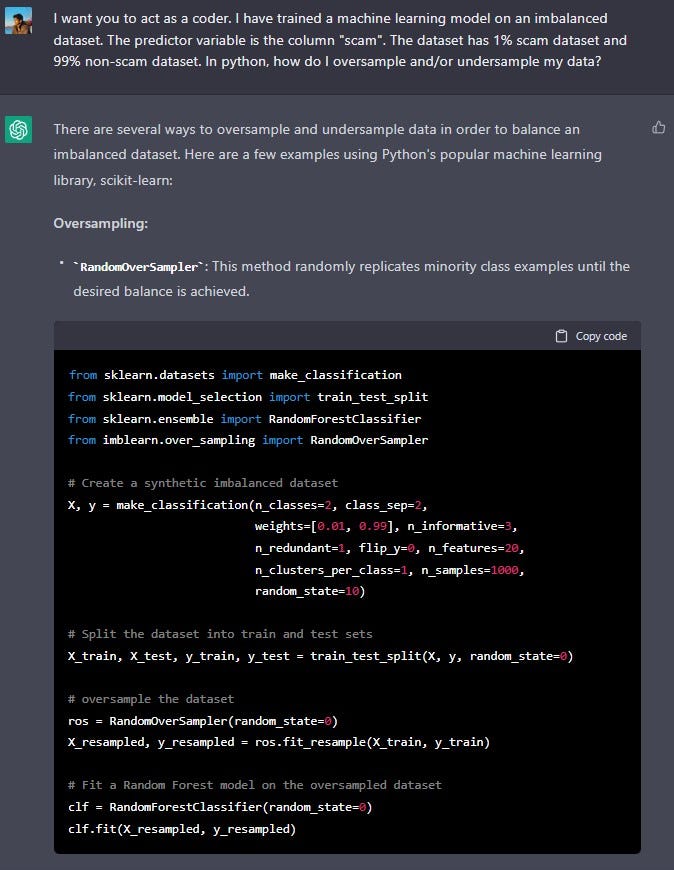
Undersampling:
RandomUnderSampler: This method randomly removes majority class examples until the desired balance is achieved.
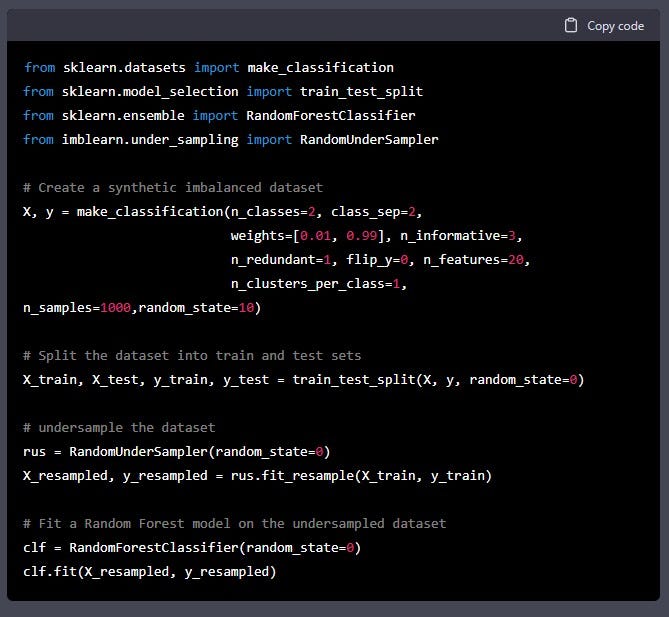
This code first creates a synthetic imbalanced dataset using make_classification function of sklearn, it then split the dataset into train and test sets, then it uses the RandomUnderSampler from imbalanced-learn package to randomly remove majority class examples until the desired balance is achieved, and finally it fits a Random Forest model on the undersampled dataset.
Please keep in mind that oversampling and undersampling methods can have a trade-off between balancing the dataset and losing valuable data. Also, depending on the data, oversampling/undersampling might not be the best solution to solve the problem.
9. Get Feature Importance
I want you to act as a data scientist and explain the model's results. I have trained a decision tree model and I would like to find the most important features. Please write the code.
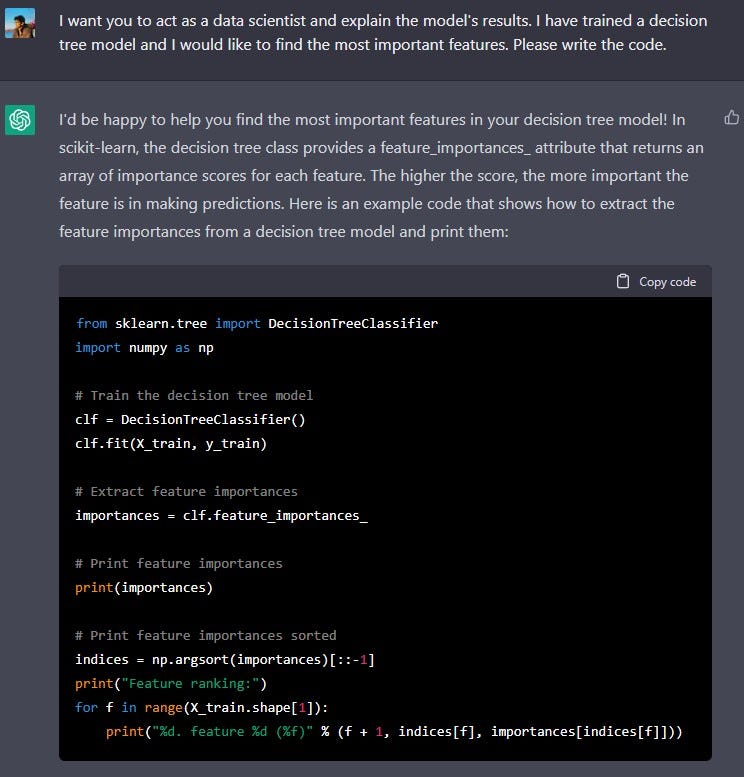
This code trains a decision tree classifier on the X_train and y_train data, extracts the feature importances using the feature_importances_ attribute, sorts them in descending order, rearranges the feature names to match the sorted feature importances and plots them in a bar chart for better visualization and understanding of the results.
10. Visualize Data with Matplotlib
I want you to act as a coder in python. I have a dataset [name] with columns [name]. [Describe graph requirements]
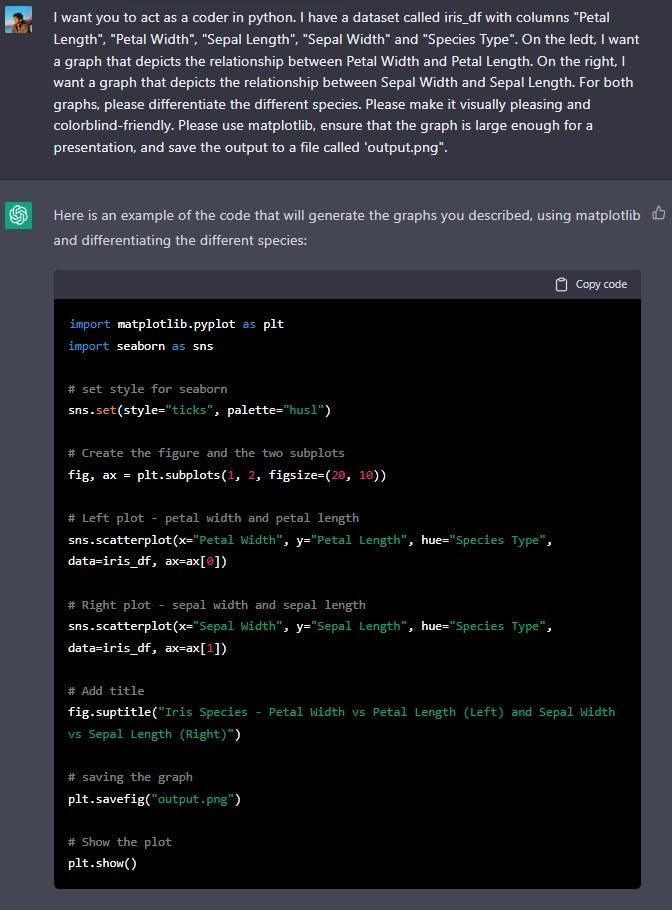
This code uses the seaborn library to create a scatter plot for each graph, it uses the hue parameter to differentiate the different species, and it sets the color palette to be colorblind friendly. The code also adds a title to the figure and saves it to a file 'output.png' and shows the graph.
11. Visualize Image Grid Matplotlib
I want you to act as a coder. I have a folder of images. [Describe how files are organized in directory] [Describe how you want images to be printed]
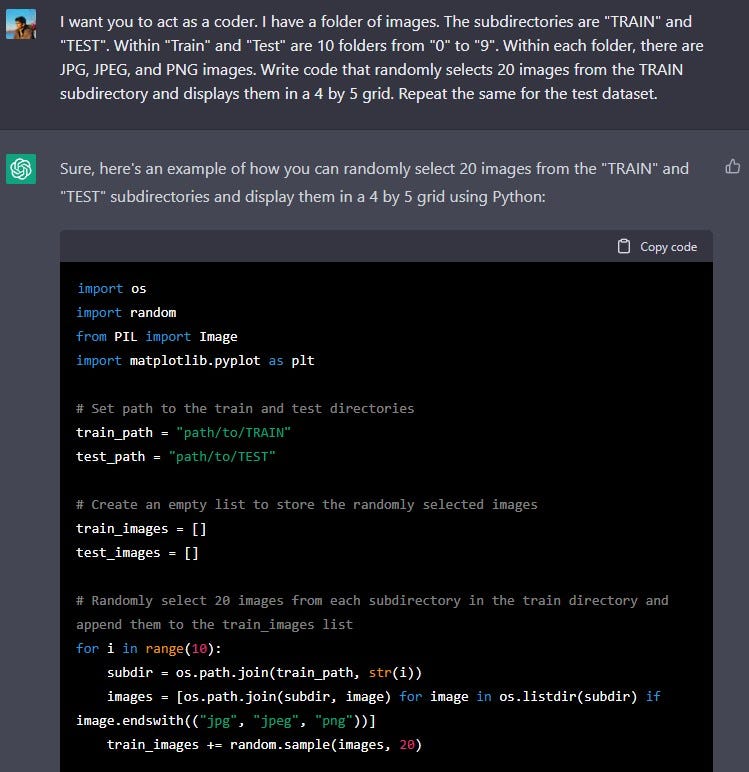
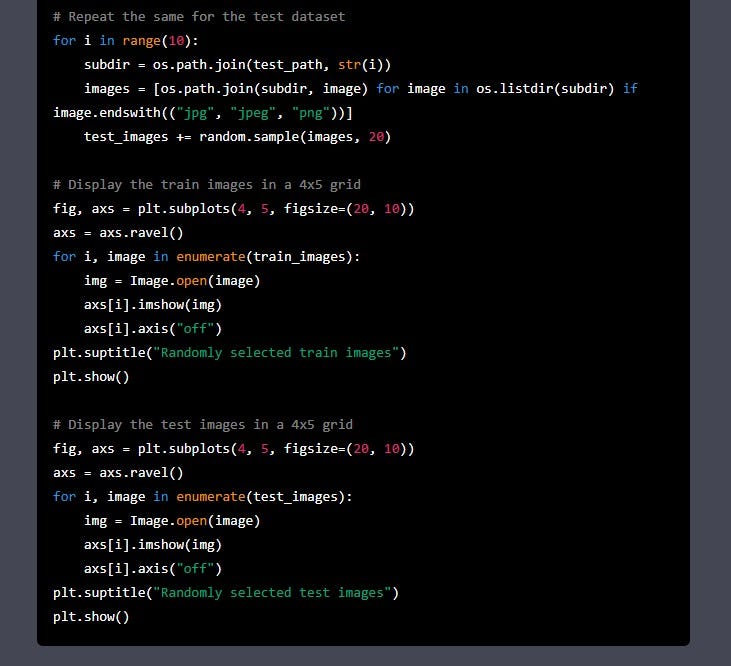
This code first sets the path to the "TRAIN" and "TEST" directories, then it uses a for loop to iterate through the subdirectories (0--9) and selects 20 random images from each subdirectory and appends them to the train_images and test_images list. Next, the code uses matplotlib to display the images in a 4x5 grid, the title of the graph indicates if it's the train or test images.
Please note that you will need to replace "path/to" with the actual path to your "TRAIN" and "TEST" directories. Also, you can use os.path.join() method to join the path and subfolder names, it will make the code more platform independent.
All the above prompts have been curated by Travis Tang.
Comments
Loading comments…