Word2Vec algorithm is a natural language processing technique invented at Google in two papers in 2013. It consists of models used for mapping words to vectors of real numbers, or in other words, for generating embeddings. The basic idea behind word embeddings is that words that occur in a similar context in a text tend to be closer to each other in vector space. Since then, using the vector representations of words in machine learning models has become a widely established standard. In many cases, training a recurrent neural network (RNN) model without an embedding layer does not make much sense.
This article explains the question: “How can we cluster textual data based on the semantic meaning of the words in the corpus?”. The intuition here is that vector representations of words learned with word2vec should put semantically similar words close to each other in a 2-D space. With a proper clustering technique, we can group words from the text into similar groups and work with the clusters later in the analytical process.
Implementation in Python will go in these steps:
- data cleaning (removing punctuation, numbers, and stopwords)
- training word2vec model
- dimensionality reduction with Principal Component Analysis (PCA)
- Clustering with K-means
I will not go much into the statistical details of word2vec, PCA, and K-means. For more information, you might check these references: word2vec, PCA, K-means.
Data and pre-processing
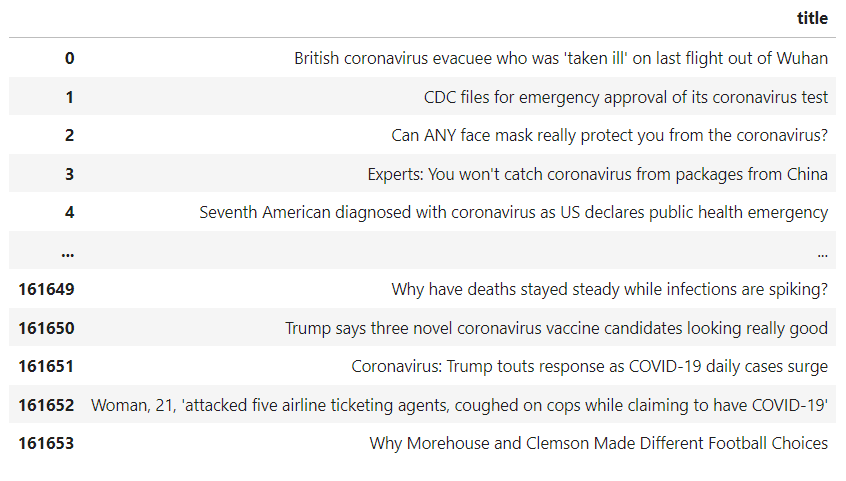
For the illustration, I will use the Coronavirus News Headlines dataset from Kaggle, which contains the headlines of news articles on Covid 19-related topics from news portals such as BBC, Aljazeera, and National Post.
Here's how the dataset looks like:
The data needs to be cleaned from punctuation, letters, and stopwords (a set of words with a low value for the language modeling that can be filtered out).
Let's import Pandas, Nlt toolkit for stop words, and re for string operations. Only English stopwords are downloaded:
import pandas as pd

from nltk.corpus import stopwords

import re

stop = set(stopwords.words("english"))
Next, these functions will do the necessary pre-processing and stop words removal:
def preprocess(text):

text_input = re.sub('[^a-zA-Z1-9]+', ' ', str(text))

output = re.sub(r'\d+', '',text_input)

return output.lower().strip()

def remove_stopwords(text):

filtered_words = [word.lower() for word in text.split() if word.lower() not in stop]

return " ".join(filtered_words)
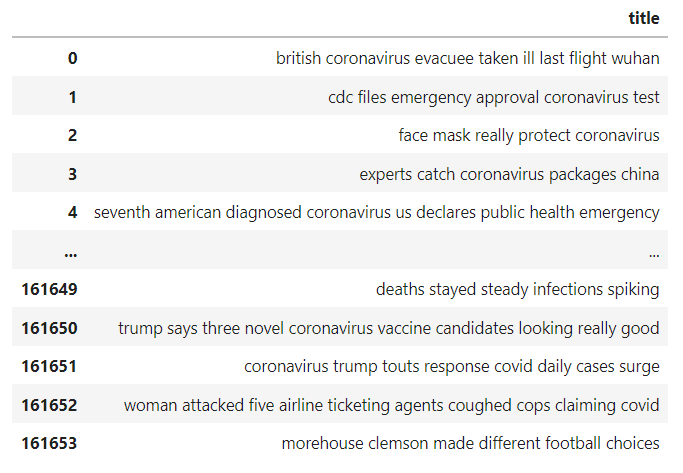
Mapping both functions to the data performs the necessary data cleaning.
data['title'] = data.title.map(preprocess)

data['title'] = data.title.map(remove_stopwords)
Here's how the clean data looks like:
Word2vec model training
Word2vec model is nicely implemented in the Gensim library. The data for the model should be in the list of lists form where every word from a headline is an item of a list.
We'll build the corpus of data this way:
def build_corpus(data):
corpus = []
for sentence in data.iteritems():
word_list = sentence[1].split(" ")
corpus.append(word_list)
return corpus
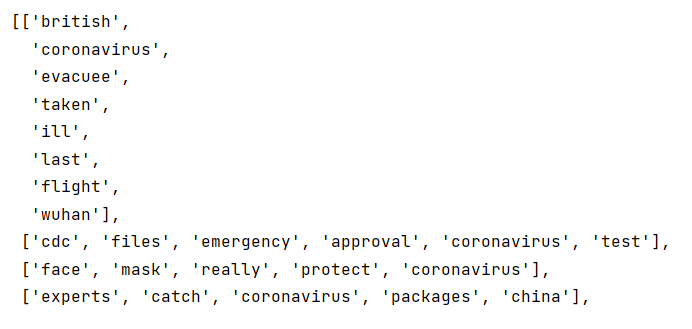
corpus = build_corpus(data['title'])
Now, the corpus looks like this:
Finally, we compile and train a word2vec model. The model produces high-dimensional vectors, where the size parameter sets the number of dimensions. The optimal number of dimensions depends on the size of the dataset. In our case, 100 dimensions seem to be working very well. min_count parameter controls the minimum frequency of words. Model training ignores all words with a total frequency lower than this value.
from gensim.models import Word2Vec

model = Word2Vec(corpus, size=100, min_count=1)
Dimensionality reduction with PCA
Principal Component Analysis (PCA) is one of the dimensionality reduction methods that we can use to transform the data into the X-Y coordinates that the human brain can comprehend. In my experiments, PCA worked better than another popular technique, T-SNE.
First, we fit PCA to the vectors from the word2vec model, and then we store the words and their X and Y values in a data frame:
from sklearn.decomposition import PCA

# fit a 2d PCA model to the vectors

vectors = model[model.wv.vocab]

words = list(model.wv.vocab)

pca = PCA(n_components=2)

PCA_result = pca.fit_transform(vectors)

# prepare a dataframe

words = pd.DataFrame(words)

PCA_result = pd.DataFrame(PCA_result)

PCA_result['x_values'] =PCA_result.iloc[0:, 0]

PCA_result['y_values'] =PCA_result.iloc[0:, 1]

PCA_final = pd.merge(words, PCA_result, left_index=True, right_index=True)

PCA_final['word'] =PCA_final.iloc[0:, 0]

PCA_data_complet =PCA_final[['word','x_values','y_values']]
In this way, PCA reduced the original dimensionality of the data to 2 dimensions. This allows us to make the final step and cluster the words based on their semantic meaning with a classic K-means clustering algorithm. To be more illustrative, the dataset was restricted to 100 most frequent words.
K-means clustering
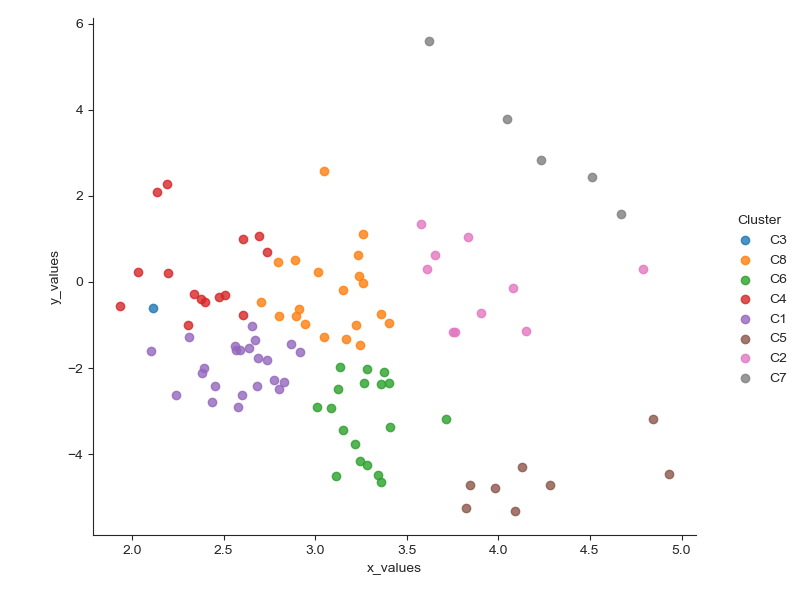
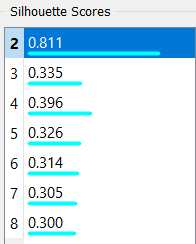
I made the K-means clustering in Orange, which comes as a standard part of Anaconda distribution. It is quicker than programming the analysis from the scratch. The number of clusters is generally set based on the elbow method or a silhouette score. Looking at the data, I set the number of clusters to 8 and used the silhouette scores only as an inspiration.
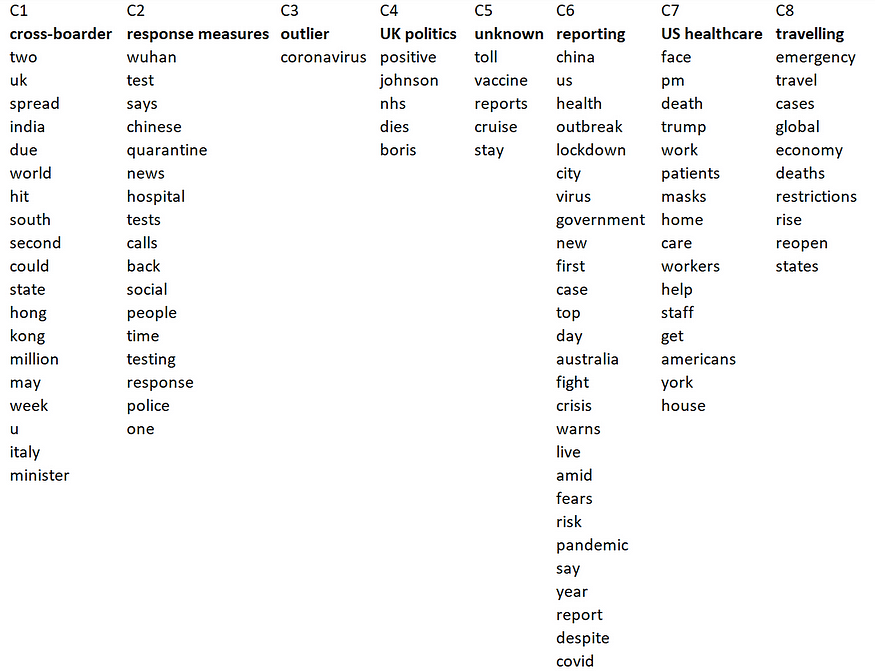
K-means clustering shows very interesting results. From 8 clusters, one appears to be an outlier (C3). Cluster 1 contains words that are often related to the spread of Covid-19 to other countries. Cluster 2 has many words that reflect response measures. Cluster 4 is about the UK Prime Minister Boris Johnson, while cluster 6 contains terms related to reporting and monitoring the crisis. Cluster 7 includes words about US healthcare, and cluster 8 is about travel restrictions.
Finally, this piece of code plots the data in a scatter plot, which is in the introduction of this article.
import seaborn as sns

from matplotlib import pyplot as plt

sns.set_style('ticks')

fig = sns.lmplot(x='x_values', y='y_values',

data = K_means_data,

fit_reg=False,

legend=True,

hue='Cluster')

fig = plt.gcf()

fig.set_size_inches(8, 6)

plt.show()
Conclusion
I have shown a guideline for clustering textual data with a very modern NLP approach. The limitation of working with textual information is that we need to work with string values as with numbers. Here, word2vec is a very handful approach because it tends to keep the semantics of the words, and it puts words that are used in a similar context close to each other in vector space.
A practical use case for the word2vec clustering is customer segmentation, where we can identify customers with specific problems from a large corpus of product reviews and comments. Companies will then target a particular customer segment and serve their needs with higher priority.
Jupiter notebook with the python code is available from my GitHub, so please feel free to use it.
PS: You can subscribe to my email list to get notified every time I write a new article.
Comments
Loading comments…