Exporting data is a crucial step in any data analysis project. Whether you’re sharing results with colleagues or preparing data for further analysis in different tools, how you export your data can make a significant difference in terms of efficiency and usability. In this article, we’ll explore efficient ways to export data using Python.
1. Exporting to Common Formats
Python provides various libraries and methods for exporting data to common formats like CSV and Excel. These formats are widely supported and can be easily imported into other software applications.
CSV (Comma-Separated Values): The pandas library makes it simple to export data frames to CSV files using the to_csv() function. You can specify delimiters, encoding, and other options to customize the output.
import pandas as pd
df.to_csv('data.csv', index=False)
Excel: To export data to an Excel file, you can use the to_excel() function in pandas. This is particularly useful when you want to create spreadsheets for reporting purposes.
df.to_excel('data.xlsx', index=False)
2.Saving Excel file
For this we need two libraries: os and xlswriter.
Select the folder you want to save it and assign a name for the file. Also specify that the engine to use is Xlsxwriter.
output_file = os.path.join('C:/My Documents/Python/Dataset/ny_station.xlsx')
writer = pd.ExcelWriter(output_file, engine='xlsxwriter')
writer._save()
3. Customizing Excel Export
Exporting data to Excel is often more than just saving a file; it’s about creating a user-friendly and visually appealing document. Let’s dive into some advanced techniques:
Freeze Panes: To enhance readability, you can freeze the first row and first column in Excel. This ensures that headers and important information remain visible as you scroll through large datasets.
ny.to_excel(writer, index=False, sheet_name='ny', freeze_panes=(1, 1))
👉Additionally, also learn how to import Excel contacts into Google contacts the right way:
Autofit And Thousand Separators.
In Excel, we need to take the time to select all the columns and autofit them. In addition, it is difficult to read long numbers without the thousand separator. Sure, this is not a big deal, we can fix it in Excel in 2 seconds. But why do we have to do all this if Python can do the work for us?
We can see that the autofit and the thousand separators worked as expected.

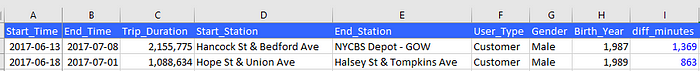
Add Color To The Column Names
I’m beginning to appreciate the visual appeal of the document. However, there’s room for further enhancement. It would be aesthetically pleasing to apply a blue background color to the column names and set their font color to white.

# Define header_format with blue background and white font for header row
header_format = workbook.add_format({'bg_color': '#3366FF', 'font_color': '#FFFFFF'})
Conditional Formatting
Excel’s conditional formatting is a powerful feature. With Python, you can apply it programmatically. For example, you can set the font color to blue if the value in the ‘diff_minutes’ column is greater than 0, and red if it’s less than 0.
# Add conditional formatting to change the font color of 'diff_minutes' cells to blue if the value is > 0, and red if the value is < 0
diff_minutes_idx = ny.columns.get_loc('diff_minutes') # Finds the column index of the 'diff_minutes' column in the 'ny' dataframe
diff_minutes_range = xlsxwriter.utility.xl_range(1, diff_minutes_idx, ny.shape[0], diff_minutes_idx) # Creates a range string that spans the 'diff_minutes' column in the worksheet (starting from row 2)
red_font_format = workbook.add_format({'font_color': '#FF0000'}) # Creates a cell format with red font color that will be used to highlight cells in the 'diff_minutes' column that have negative values
blue_font_format = workbook.add_format({'font_color': '#0000FF'}) # Creates a cell format with blue font color that will be used to highlight cells in the 'diff_minutes' column that have positive values
worksheet.conditional_format(diff_minutes_range, {'type': 'cell', 'criteria': '<', 'value': 0, 'format': red_font_format}) # Applies a conditional format to the 'diff_minutes' column in the worksheet that highlights cells with values less than 0 with the 'red_font_format'
worksheet.conditional_format(diff_minutes_range, {'type': 'cell', 'criteria': '>', 'value': 0, 'format': blue_font_format}) # Applies a conditional format to the 'diff_minutes' column in the worksheet that highlights cells with values greater than 0 with the 'blue_font_format'
Highlight Specific Columns
Cater to stakeholders’ preferences by highlighting specific columns in a distinct way. For instance, you can make one column appear in gray with red font color to draw attention.
These customization options might seem complex at first but can significantly improve the visual appeal and usability of your exported Excel files.

# Add conditional formatting to highlight the 'Start_weekday_or_weekend' column in light grey.
Start_weekday_or_weekend_idx = ny.columns.get_loc('Start_weekday_or_weekend') # Finds the column index of the 'Start_weekday_or_weekend' column in the 'ny' dataframe
Start_weekday_or_weekend_range = xlsxwriter.utility.xl_range(1, Start_weekday_or_weekend_idx, ny.shape[0] , Start_weekday_or_weekend_idx) # Creates a range string that spans the 'Start_weekday_or_weekend' column in the worksheet (starting from row 2)
Start_weekday_or_weekend_format = workbook.add_format({'bg_color': '#D3D3D3', 'font_color': '#FF0000'}) # Creates a cell format that will be used to highlight cells in the 'Start_weekday_or_weekend' column
worksheet.conditional_format(Start_weekday_or_weekend_range, {'type': 'no_blanks', 'format': Start_weekday_or_weekend_format}) # Applies a conditional format to the 'Start_weekday_or_weekend' column in the worksheet that highlights cells that are not blank with the 'Start_weekday_or_weekend_format'
Apply all these changes to the entire dataset
Apply all these changes to the entire dataset by iterating through each column in the ‘ny’ dataframe. For each column, write the column name to the first row of the worksheet using the ‘header_format’ to ensure consistent styling. Finally, save the changes made to the workbook object by the writer using ‘writer._save()’
# Iterates through each column in the 'ny' dataframe and writes the column name to the first row of the worksheet with the 'header_format'
for col_idx, column in enumerate(ny.columns):
    worksheet.write(0, col_idx, column, header_format)

writer._save() # Saves the changes made to the workbook object by the writer
Conclusion
In this article, we’ve explored data export using Python, emphasizing efficiency and usability. Exporting data is crucial in data analysis, and Python provides powerful tools for streamlining this process.
We started by discussing common formats like CSV and Excel, demonstrating efficient data frame exports using pandas. We emphasized the importance of customizing Excel exports for user-friendly, visually appealing documents.
We also covered advanced techniques like freezing panes for readability, autofitting columns, and adding thousand separators. Additionally, we added color to column names and applied conditional formatting programmatically to simplify data interpretation.
Python can handle these tasks, saving time and effort in Excel post-processing. These customization options, though intricate at first, greatly enhance the visual appeal and usability of exported Excel files.
Full Code
# #Export to excel
output_file = os.path.join('C:/My Documents/Python/Dataset/ny_station1.xlsx')
writer = pd.ExcelWriter(output_file, engine='xlsxwriter')

#Freeze panes
ny.to_excel(writer, index=False, sheet_name='ny', freeze_panes=(1,1))

# Assigns the workbook object to the "workbook" variable, which is an instance of the Workbook class in the xlsxwriter module
workbook = writer.book

# Assigns the worksheet object to the "worksheet" variable, which represents the 'ny' sheet in the workbook
worksheet = writer.sheets['ny']

# Creates a text format object that can be used to format cells in the worksheet. The format specifies the '@' number format which treats any input as a text string.
text_format = workbook.add_format({'num_format': '@'})

# Creates a numeric format object that can be used to format cells in the worksheet. The format specifies a '#,##0' number format which formats numbers with thousands separators.
num_format = workbook.add_format({'num_format': '#,##0'})
###########################################################
# Set the number format for all columns and autofit.
# Loops over each column in the 'ny' dataframe using enumerate to get both the column index and the column name
for col_idx, column in enumerate(ny.columns):
    column_length = max(ny[column].astype(str).map(len).max(), len(column)) # Finds the maximum length of the values in the current column, including the length of the column name
    worksheet.set_column(col_idx, col_idx, column_length, num_format) # Sets the column width of the current column in the worksheet to be the maximum length found, using the specified num_format

# Add conditional formatting to highlight the 'Start_weekday_or_weekend' column in light grey.
Start_weekday_or_weekend_idx = ny.columns.get_loc('Start_weekday_or_weekend') # Finds the column index of the 'Start_weekday_or_weekend' column in the 'ny' dataframe
Start_weekday_or_weekend_range = xlsxwriter.utility.xl_range(1, Start_weekday_or_weekend_idx, ny.shape[0] , Start_weekday_or_weekend_idx) # Creates a range string that spans the 'Start_weekday_or_weekend' column in the worksheet (starting from row 2)
Start_weekday_or_weekend_format = workbook.add_format({'bg_color': '#D3D3D3', 'font_color': '#FF0000'}) # Creates a cell format that will be used to highlight cells in the 'Start_weekday_or_weekend' column
worksheet.conditional_format(Start_weekday_or_weekend_range, {'type': 'no_blanks', 'format': Start_weekday_or_weekend_format}) # Applies a conditional format to the 'Start_weekday_or_weekend' column in the worksheet that highlights cells that are not blank with the 'Start_weekday_or_weekend_format'


# Add conditional formatting to change the font color of 'diff_minutes' cells to blue if the value is > 0, and red if the value is < 0
diff_minutes_idx = ny.columns.get_loc('diff_minutes') # Finds the column index of the 'diff_minutes' column in the 'ny' dataframe
diff_minutes_range = xlsxwriter.utility.xl_range(1, diff_minutes_idx, ny.shape[0], diff_minutes_idx) # Creates a range string that spans the 'diff_minutes' column in the worksheet (starting from row 2)
red_font_format = workbook.add_format({'font_color': '#FF0000'}) # Creates a cell format with red font color that will be used to highlight cells in the 'diff_minutes' column that have negative values
blue_font_format = workbook.add_format({'font_color': '#0000FF'}) # Creates a cell format with blue font color that will be used to highlight cells in the 'diff_minutes' column that have positive values
worksheet.conditional_format(diff_minutes_range, {'type': 'cell', 'criteria': '<', 'value': 0, 'format': red_font_format}) # Applies a conditional format to the 'diff_minutes' column in the worksheet that highlights cells with values less than 0 with the 'red_font_format'
worksheet.conditional_format(diff_minutes_range, {'type': 'cell', 'criteria': '>', 'value': 0, 'format': blue_font_format}) # Applies a conditional format to the 'diff_minutes' column in the worksheet that highlights cells with values greater than 0 with the 'blue_font_format'

# Set the column names to blue with white font
header_format = workbook.add_format({'bg_color': '#3366FF', 'font_color': '#FFFFFF'}) # Creates a cell format with a blue background and white font that will be used to format the header row

# Iterates through each column in the 'ny' dataframe and writes the column name to the first row of the worksheet with the 'header_format'
for col_idx, column in enumerate(ny.columns):
    worksheet.write(0, col_idx, column, header_format)

writer._save() # Saves the changes made to the workbook object by the writer
Comments
Loading comments…