Photo by Slidebean on Unsplash
Chart.js is an open-source JavaScript library, which is simple and clean, and engages HTML5-based JavaScript charts. Chart.js is an easy way to include animated, interactive graphs on your website for free. In this tutorial, we will add a chart from Chart.js in an Ionic (Angular) application.
1. Install Chart.js
I am assuming that you already have an Ionic project created in which you want to set up charts — we will be walking through an example of adding charts that can be added to any page you like.
To begin, first, we are going to install the Chart.js library using npm. Just run the following command:
npm install chart.js --save
Now we can use Chat.js anywhere we want — add the following code in any page.ts or any component.ts
In your project import like this:
import { Chart } from 'chart.js';
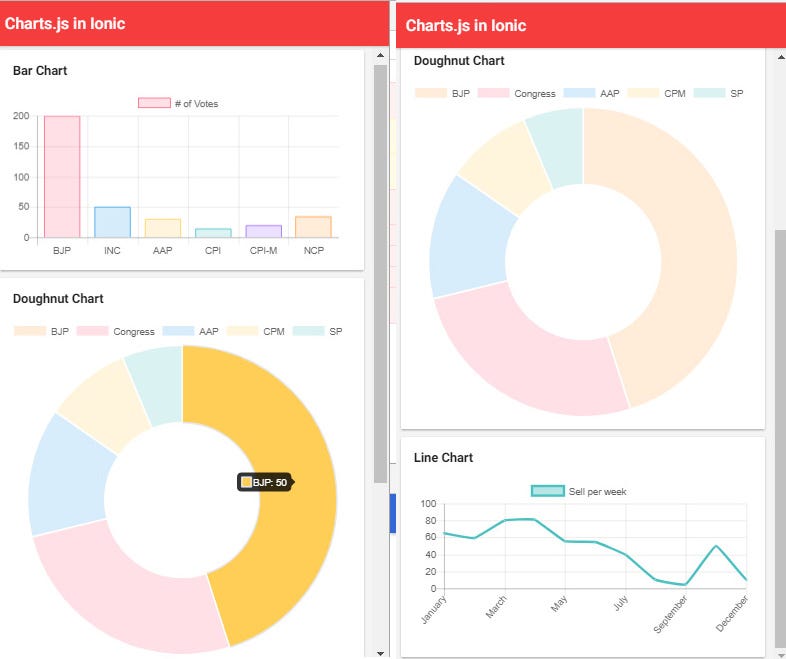
We'll learn to create doughnut, bar, and a line chart, in order to display the chart we need a canvas element. We have 3 cards, each card has an element canvas element, and we add a local variable like #barCanvas for each canvas to get a reference to it in our TypeScript file.
Your TypeScript file should have the following code:
2. Set up the Template
Chart.js uses an HTML5 canvas element to display the charts, so we will need to set that up in our template.
Your template (HTML) file should have the following code:
The charts in your application should be displayed like this:
Hope this helps!
See you later 👋👋
Help others find the article, so it can help them!
Comments
Loading comments…