
So, for all of you Dune geeks and Python lovers, I wanted to write my first article about Python with an explanation of code, so I decided to make a code that counts the number of occurrences of the top 10 words in Dune Messiah by Frank Herbert for the upcoming move ‘Dune: Part Two’.
We start by importing the necessary modules: Counter from collections, re for regular expressions, and matplotlib.pyplot as plt for plotting.
from collections import Counter
import re
import matplotlib.pyplot as plt
We define the get_word_frequency(file_path) function to read the text from a file, tokenize it, count word frequencies, and return the results. with excluding a few of the words that I thought would be highly shown.
def get_word_frequency(file_path):
    with open(file_path, 'r', encoding='utf-8') as file:
        text = file.read()
        words = re.findallr'\b(?!(?:the|of|a|to|and|he|in|his|it|you|said|that|i|s|she|was|with|her|this|at|for|on|is|'
                           r'had|they|him|as|from|there|be|but|we|my|not|one|them|have|by|what|me|your|thought|out|t|'
                           r'an|into|could|are|their|were|man|will|no|now|do|all'
                           r'|been|here|ll|ve|up|see|who|must|its|can|back|asked)\b)\w+\b', text.lower())
        word_count = Counter(words)  # Count the frequency of each word
        return word_count
Now we create a function that prints and generates a cool histogram of the words. The generate_histogram() function calls get_word_frequency() to obtain the word frequencies.
def generate_histogram():
    dune_file_path = "dune.txt"
    word_frequency = get_word_frequency(dune_file_path)
    most_common_words = word_frequency.most_common(10)  # Get the 10 most common words

    # Extract words and frequencies for plotting
    words = [word[0] for word in most_common_words]
    frequencies = [word[1] for word in most_common_words]

    print("Top 10 most common words in Dune (excluding common words):")
    for word, frequency in most_common_words:
        print(f"{word}: {frequency}")
In the same function, we implement the histogram generating using Matplotlib
# Create histogram
    plt.figure(figsize=(10, 6))
    plt.bar(words, frequencies, color='skyblue')
    plt.xlabel('Words')
    plt.ylabel('Count')
    plt.title('Top 10 Most Common Words in Dune')
    plt.xticks(rotation=45, ha='center')
    plt.tight_layout()
    plt.show()
Output:
Top 10 most common words in Dune (excluding common words):
paul: 1735
jessica: 903
baron: 593
duke: 581
fremen: 520
hawat: 429
mother: 415
stilgar: 403
water: 377
kynes: 369
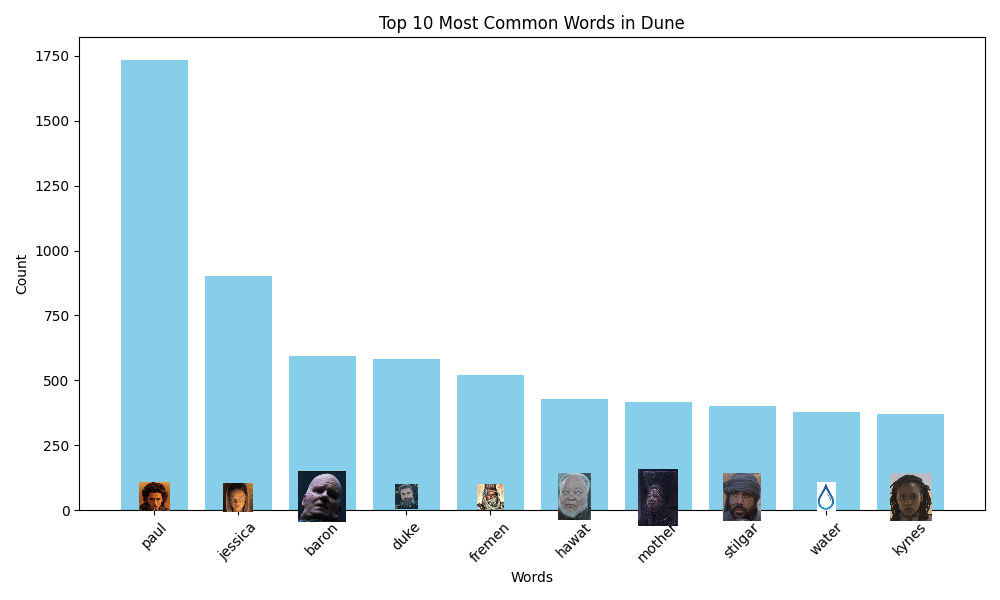 I did add a picture under every histogram in the code, but this will be on another article 😉
Let me know if you want to see more posts like this, and go read some of my other articles about code, data, and climate change.
Comments
Loading comments…