In this episode of “I couldn’t find it online, so I decided to create it,” we’ll be discussing how to scrape data, specifically tabular data, from bank statements using Python.
When I was initially assigned this project, I had a sinking feeling because I believed I might have to delve into computer vision, train a model (which might still happen), or utilize OCR (Optical Character Recognition), which can potentially wreak havoc on a document if you’re not familiar with it.
Luckily, I wasn’t the first person to encounter a problem similar to this. I discovered a variety of packages, such as pdfminer, PyPDF2, and pikepdf, just to name a few. Each of these packages has its own strengths and weaknesses, and I plan to leverage a combination of them in my future projects.
This article serves as Part 1 and offers a simple example of how to scrape tabular data from a bank statement using Camelot. In upcoming segments, I will delve deeper into retrieving more specific data from a document, adjusting the scraping area dynamically, and identifying column locations.
Although there are many Python packages available, I found Camelot to be the easiest and most customizable of all the packages I’ve experimented with and if you’re anything like me, simplicity is key.
Furthermore, the coup de grâce is that Camelot can output the data as a pandas DataFrame, which essentially sealed the deal for me.
Installing Camelot
I found installing Camelot to be quite challenging, but I also realized the importance of reading. Therefore, I hope that the steps I provide below can save you a lot of time and frustration:
Step 1 — Installing Camelot:
To install Camelot you can use the following pip command in your IDE
pip install "camelot-py[base]"
If you get stuck refer to this page in the documentation. But you still have to install the dependencies, which include Ghostscript and Tkinter.
Step 2 — Installing the dependencies:
Tkinter is easy because it’s the standard GUI (Graphical User Interface) library that comes with Python. However, if your computer has specific requirements, you can download it from here.
For Ghostscript, you can download it here, and then install it. If you don’t know if you should pick the GNU Affero General Public License or the Artifex Commercial License… I just closed my eyes and clicked.
Now everything should be ready but you can always go to this page in the documentation if you get stuck.
Now it’s time to break some bank statements 😎
Scraping Bank statement
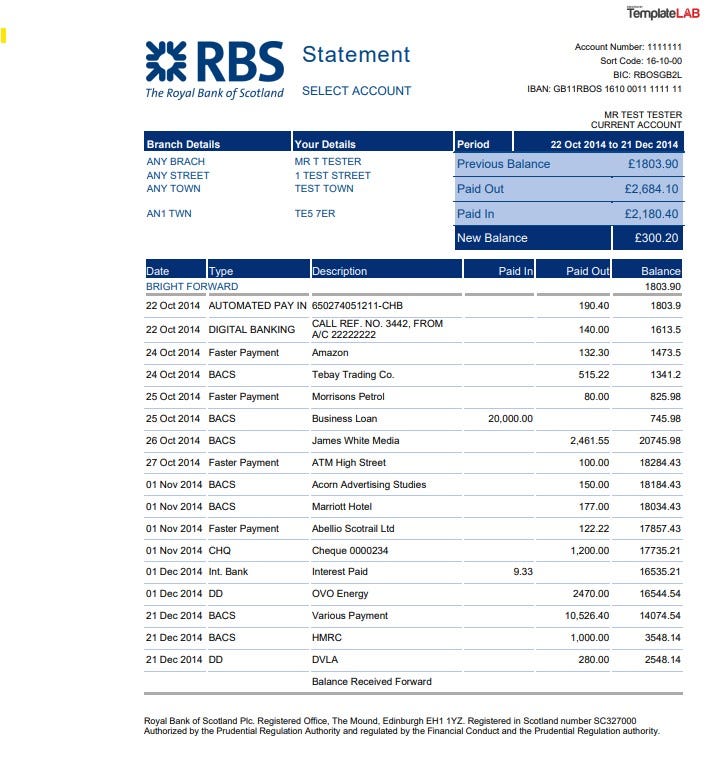
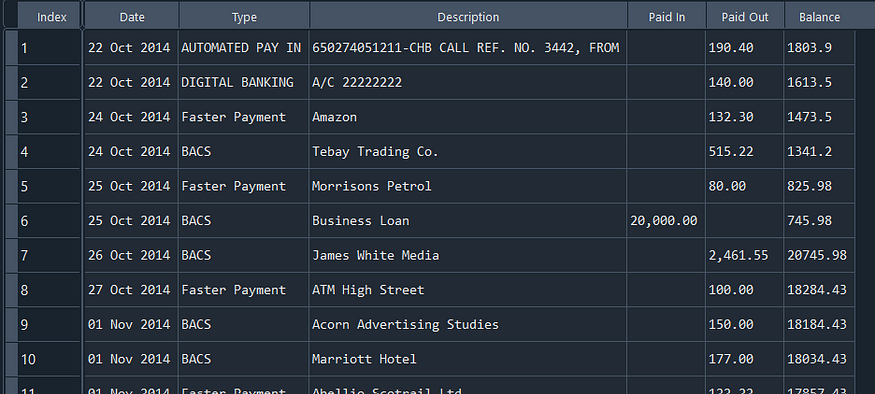
For the first example, as a way to become familiar with using Camelot, we will examine this straightforward bank statement below:
First, we are going to import all the libraries needed
import camelot
import pandas as pd
We will then specify the PDF path, let Camelot scrape the PDF, and return the first table as a DataFrame. But before we do that, there are two settings you need to understand to achieve the desired result.
The first setting is called “flavor.” This determines which table parsing methods you want Camelot to use and offers a choice between “Stream” and “Lattice.”
- Stream: This option can be used to parse tables that have spaces between cells to simulate a table structure. It is built on top of PDFMiner’s functionality, grouping characters on a page into words and sentences, using margins.
- Lattice: This option is more deterministic and does not rely on guesses. It can be used to parse tables with clearly demarcated lines between cells, and it can automatically parse multiple tables present on a page.
You can read more about these flavors here.
By default, Camelot is set to “Lattice,” which may not work in our case since there are no clearly defined lines between the cells. Therefore, we will need to specify “Stream” as our choice.
Next, we need to specify the page that we want to scrape by providing it as a string, starting from page 0.
pdf_path = r"path to your pdf"

tables = camelot.read_pdf(pdf_path, flavor='stream', pages=str(0))

table = tables[0].df
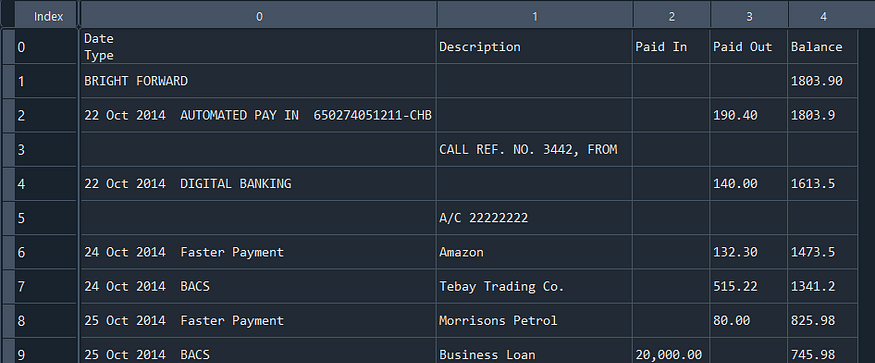
Upon inspecting the DataFrame, we can observe that Camelot did not capture the table we intended to extract, but it did capture the first item that resembled a table.
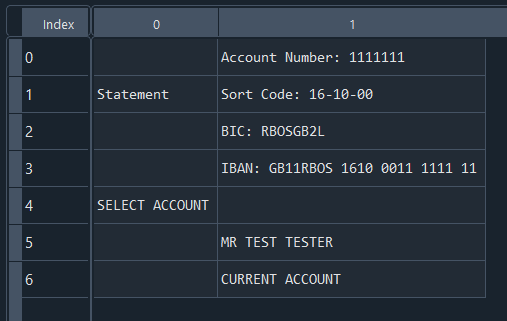
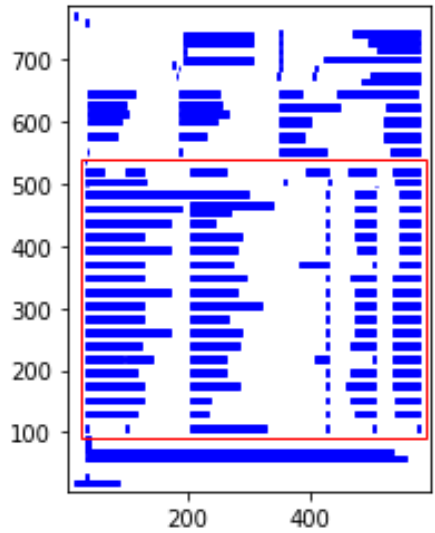
To obtain the correct table, we will need to specify the area of the table we want to scrape. However, I recommend running the code below first to visualize what Camelot actually considers to be a table.
camelot.plot(tables[0], kind='contour').show()
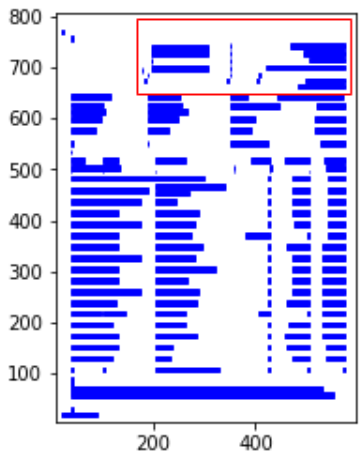
In this visualization, the red contour represents the scraped area, and the blue bars outline the text edges of words divided into sentences. We will utilize the plotting function to define the “table_areas” in Camelot, specifying the area we wish to scrape.
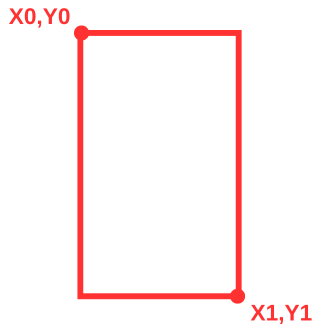
The “table_areas” is defined by a string with four coordinates separated by commas, appearing as follows: ‘X0, Y0, X1, Y1’. X0 and Y0 denote the coordinates of the top-left corner of the area, while X1 and Y1 represent the coordinates of the bottom-right corner.
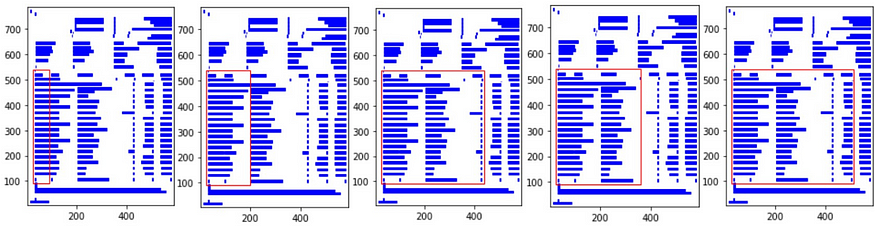
After experimenting with several options, I found the coordinates to be ‘30,540,585,90’. Plugging these in and plotting the table, we can visually confirm that we’re obtaining the desired output.
tables = camelot.read_pdf(pdf_path, flavor='stream', table_areas=['30,540,585,90'], pages=str(0))

camelot.plot(tables[0], kind='contour').show()
However, when we examine the DataFrame, we can see that the Date and Type columns have been merged together.
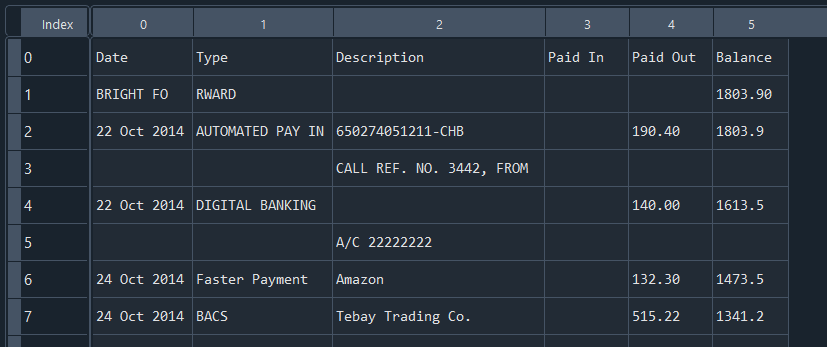
To address this issue, we will define the separation of the columns, which is essentially a string of comma-separated X coordinates. I employed the plotting function and modified the X1 coordinate within the “table_areas” variable to the X coordinates, which are now ‘95,200,360,440,510’.
Additionally, I’ve set “split_text” to True, a configuration that will divide any strings previously assigned to a single cell when they span across different cells.
tables = camelot.read_pdf(pdf_path, flavor='stream', table_areas=['30,540,585,90'],
                          columns=['95,200,360,440,510'], pages=str(0),split_text=True
If we take a look at the results, we can see that the extraction was successful, and now we can proceed with some data cleanup to complete this task.
From the results, the initial issue is that the first row, “Bright Forward,” is intruding into my date column. Since we don’t require this row for the table, I’ll remove it, and while I’m at it, I’ll also eliminate the last row, “Balance Received Forward.”
table = table.drop(1) #Drop first row
table = table[:-1] #Drop last row
Next, we can observe that the description was split into two rows whenever there were two sentences. To address this issue, I crafted the following function that will iterate through the table and merge two rows of the DataFrame whenever the date column is empty. Additionally, I introduced a “checkrow” variable that permits you to iterate over columns other than the date column. I’ve also incorporated logic to insert a space between the two merged rows, ensuring clarity and avoiding confusion.
def CleanupDF(df, checkrow = 0):
    merged_rows = []
    prev_row = None
    for _, row in df.iterrows():
        if row[checkrow] == '' and prev_row is not None:
            nr = pd.Series(index=row.index, dtype='object')
            for cell in range(0,len(row)):
                if row[cell] != '' and prev_row[cell] != '':
                    nr[cell] = prev_row[cell] + ' ' + row[cell]
                else:
                    nr[cell] = prev_row[cell] + row[cell]
            # Merge with previous row if first column is empty
            merged_rows[-1] = nr
            prev_row = nr
        else:
            merged_rows.append(row)
            prev_row = row

    return pd.DataFrame(merged_rows).reset_index(drop=True)
Lastly, I will set the first row of the DataFrame as the column headers
table.columns = table.iloc[0]
table = table[1:]
And there we have it! A table scraped and cleaned.
Thank you very much for taking the time to read my article on data scraping from bank statements. If you have any thoughts or suggestions, I would greatly appreciate hearing them in the comments section below. As always, this may not be the perfect solution, but it serves as a good initial step.
In the next installment, we will explore how to dynamically adjust the table area and columns and how to extract specific data from your PDF more efficiently.
Comments
Loading comments…