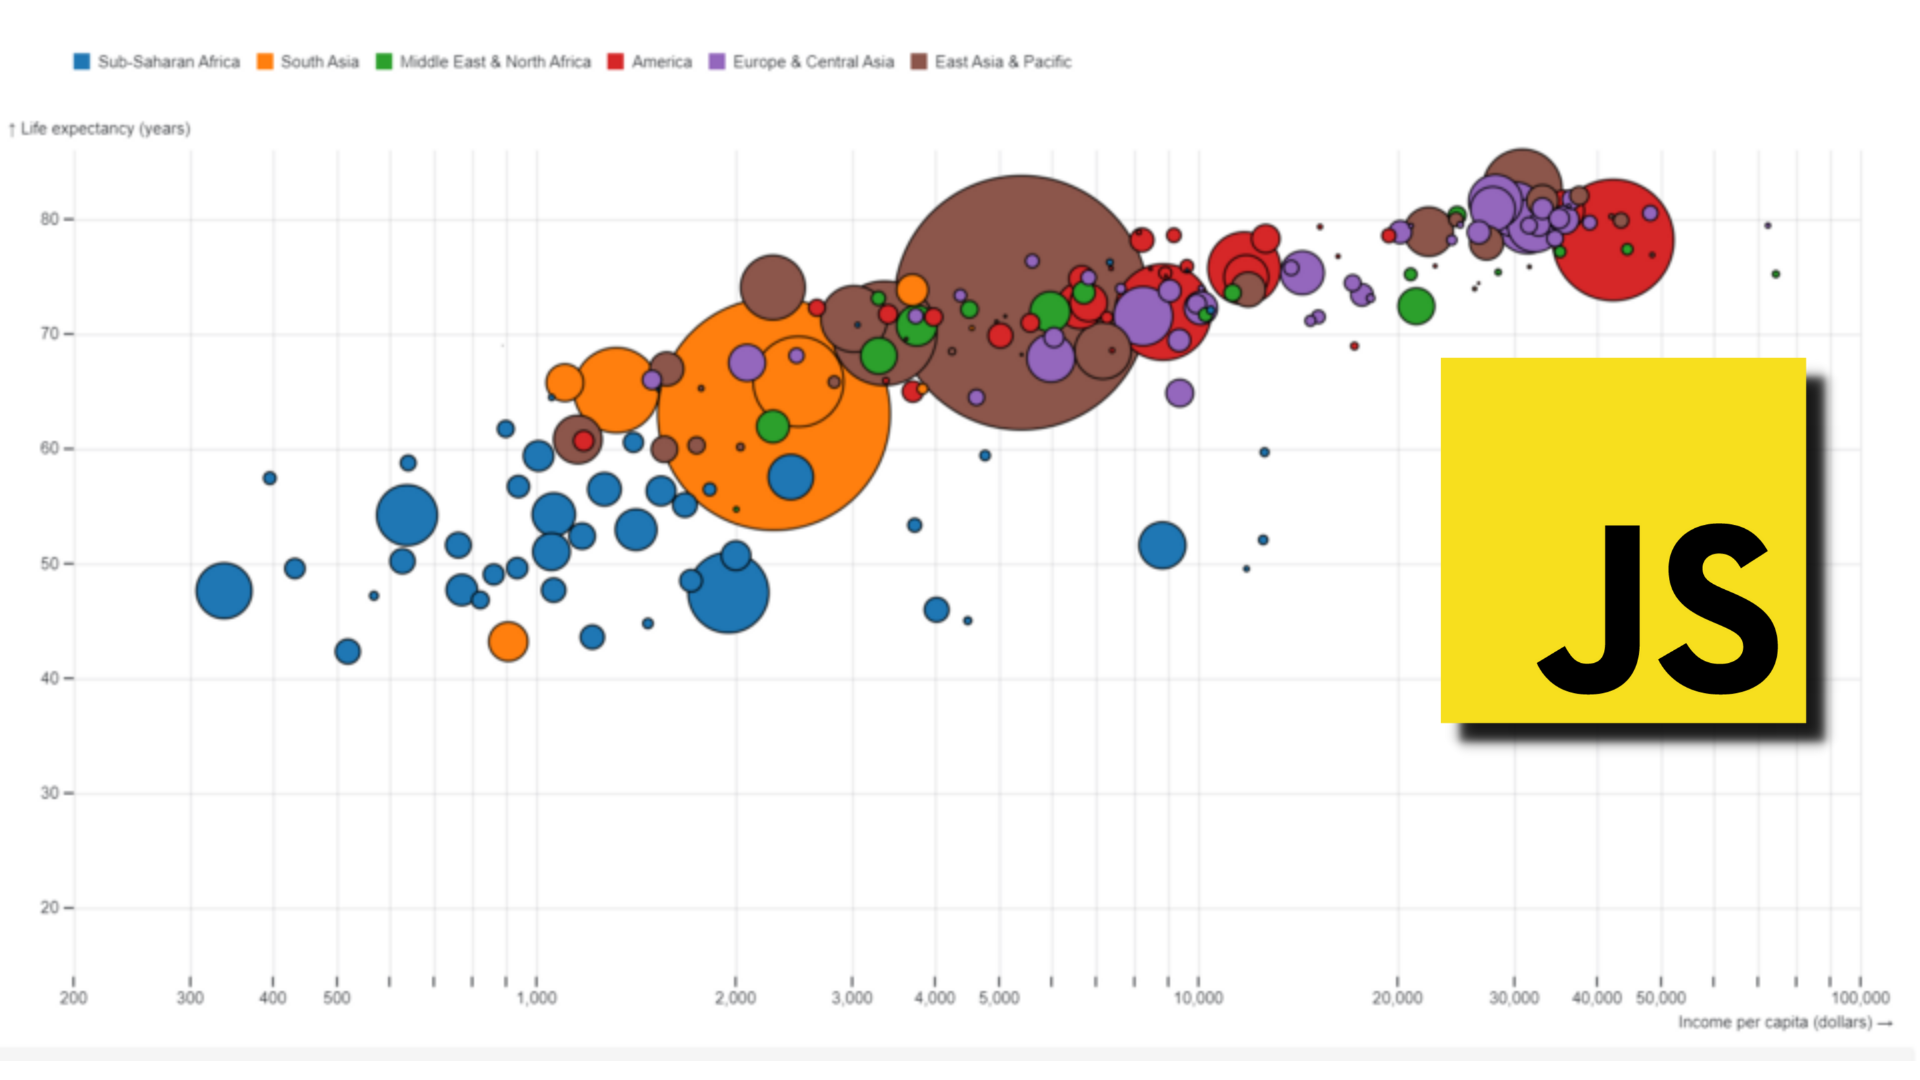
Data visualization is the visual representation of data using graphs, plots, and informational graphics. It assists us in better understanding and communicating the meaning behind the data. There are many libraries in JavaScript that helps us achieve this.
In no particular order, here are some of the best JavaScript data visualization libraries available in 2022 to help you get started and easily add beautiful data visualization to your application. Please leave a comment and share your thoughts and ideas!
1. D3.js
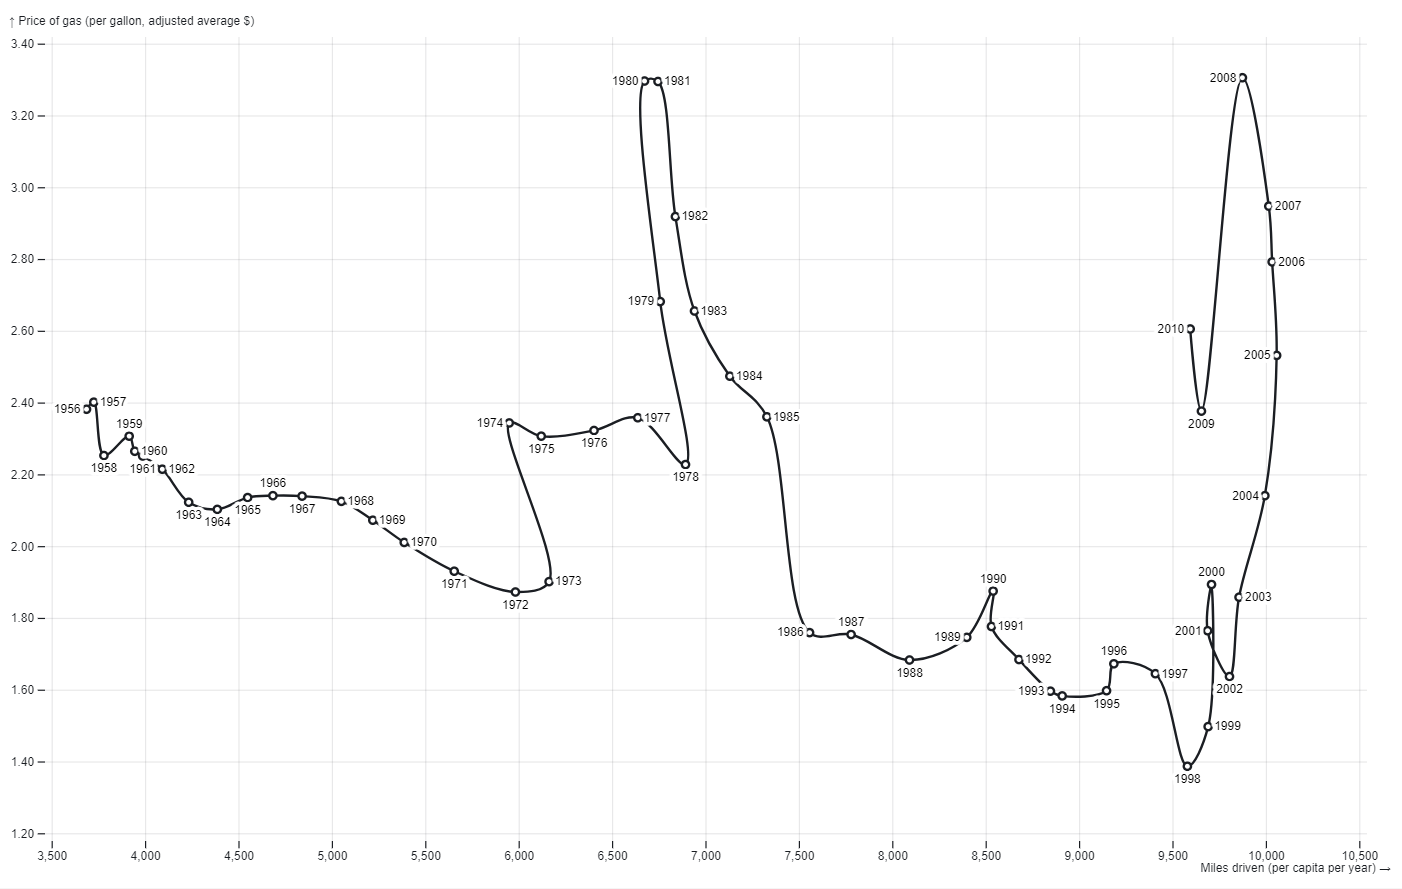 Scatterplot, Connected
D3 or D3.js is one of the most popular data visualization libraries. This library for visualizing data using web standards. It helps you bring data to life using SVG, Canvas, and HTML. To name a few, the D3 gallery contains a veritable zoo of forms: treemap, hierarchical edge bundling, Sankey diagram, density contours, and force-directed graph.
D3’s low-level approach, focusing on composable primitives such as shapes and scales rather than configurable charts gives you flexibility and creative freedom. D3 is also known for its animation capabilities that help you easily animate bar chart races or treemaps. Being one of the most widely used libraries also has its perks like a huge community that develops resources and tutorials, video essays, and books.
**Installation: **$ npm install d3
Here’s the complete documentation for you to get started.
2. Two.js
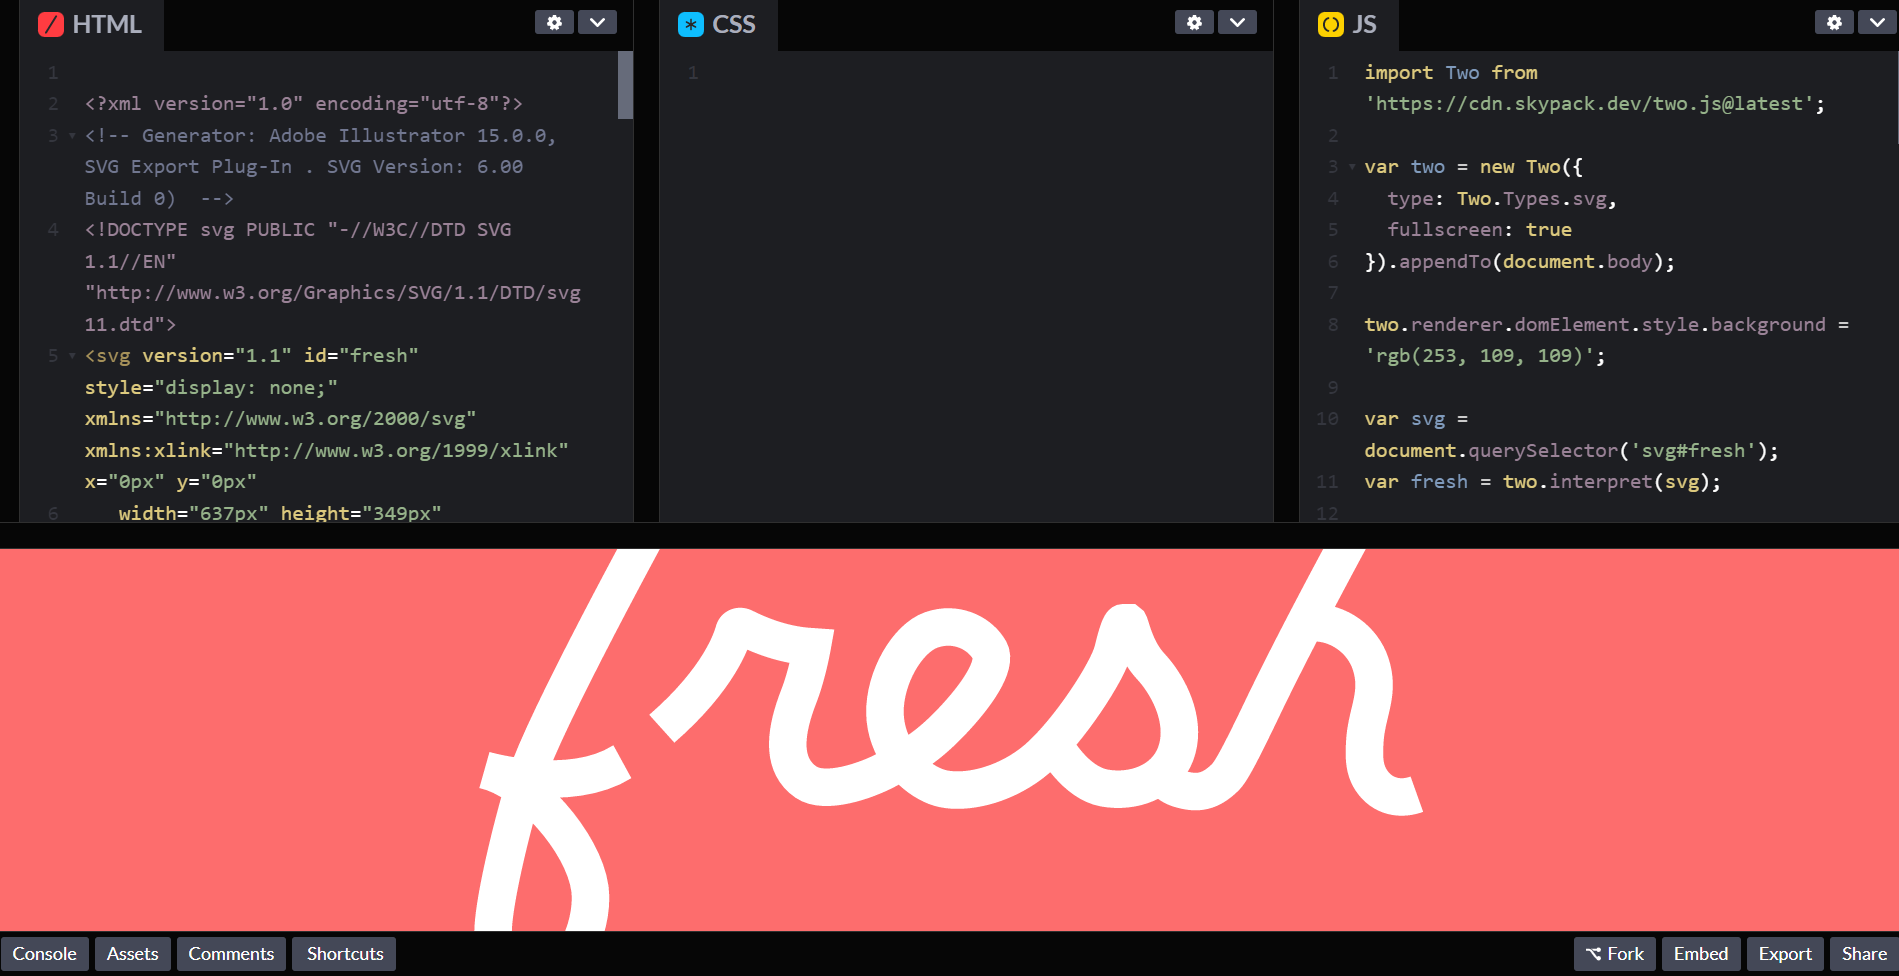
Two.js is a modern online browser-friendly two-dimensional drawing API. It is renderer agnostic, allowing the same API to draw in SVG, canvas, and WebGL contexts. Two.js is deeply inspired by flat motion graphics. As a result, two.js aims to make the creation and animation of flat shapes easier and more concise.
It also has a built-in animation loop and an SVG interpreter. Two.js offers many easy-to-use features to handle and render bitmap images. You can easily load single images, sprite sheets, and image sequences with just a few method calls.
**Installation: **$** **npm install --save two.js
Two.js documentation.
3. three.js
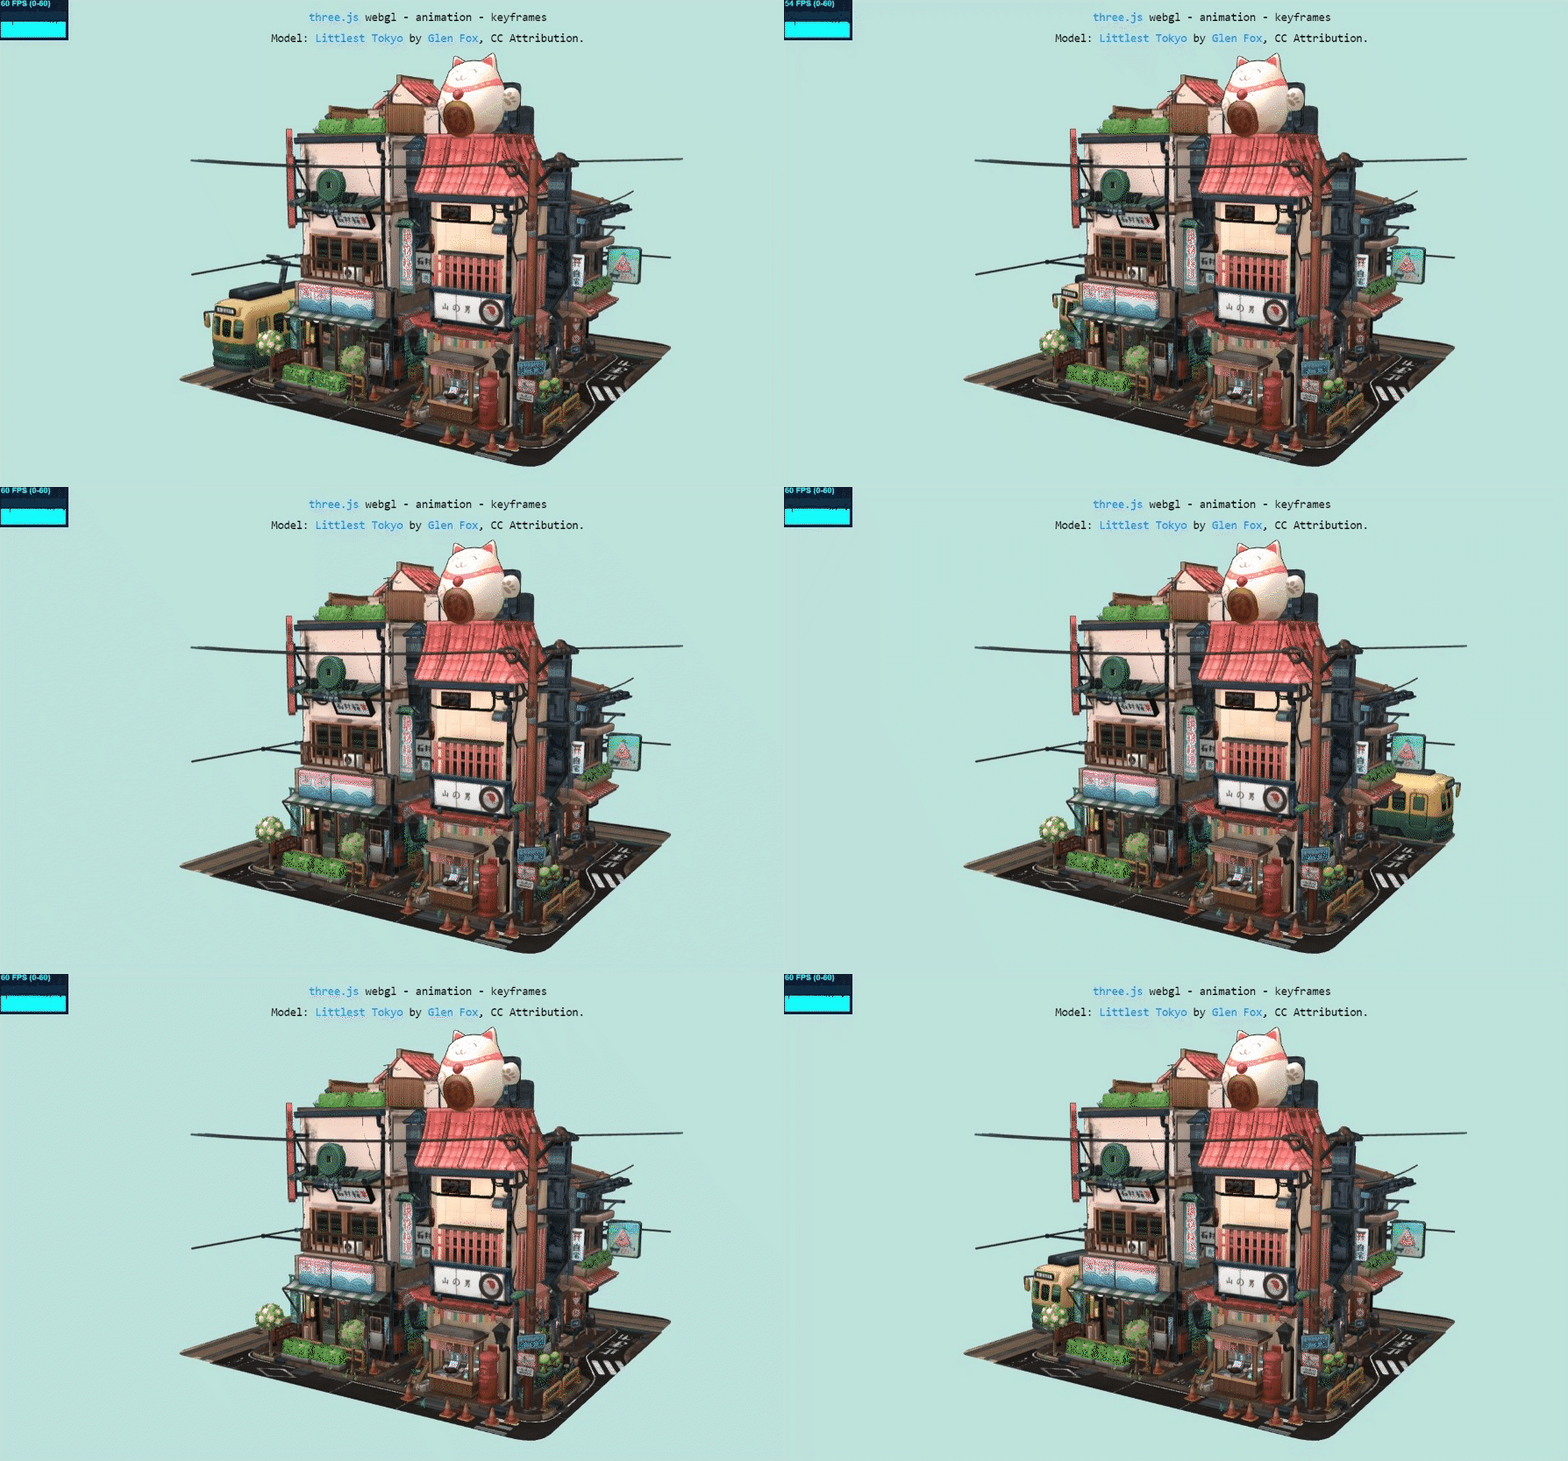
Three.js is a cross-browser JavaScript library and application programming interface (API). With three.js you can create and display animated 3D computer graphics in a web browser using WebGL. Without relying on browser plugins you will be able to create GPU accelerated 3D animations.
Three.js features include:
-
Effects: Anaglyph, cross-eyed, and parallax barrier.
-
Scenes: add and remove objects at run-time; fog
-
Cameras: perspective and orthographic; controllers: trackball, FPS, path, and more
-
Animation: armatures, forward kinematics, inverse kinematics, morph, and keyframe
-
Lights: ambient, direction, point, and spotlights; shadows: cast and receive
-
Materials: Lambert, Phong, smooth shading, textures, and more
-
Shaders: access to full OpenGL Shading Language (GLSL) capabilities: lens flare, depth pass, and extensive post-processing library.
-
Other features like Objects, Geometry, Data loaders, and Utilities with a full set of time and 3D math functions.
**Installation: **$ npm install three
Here’s the complete documentation for you to get started.
4. MetricGraphics.js
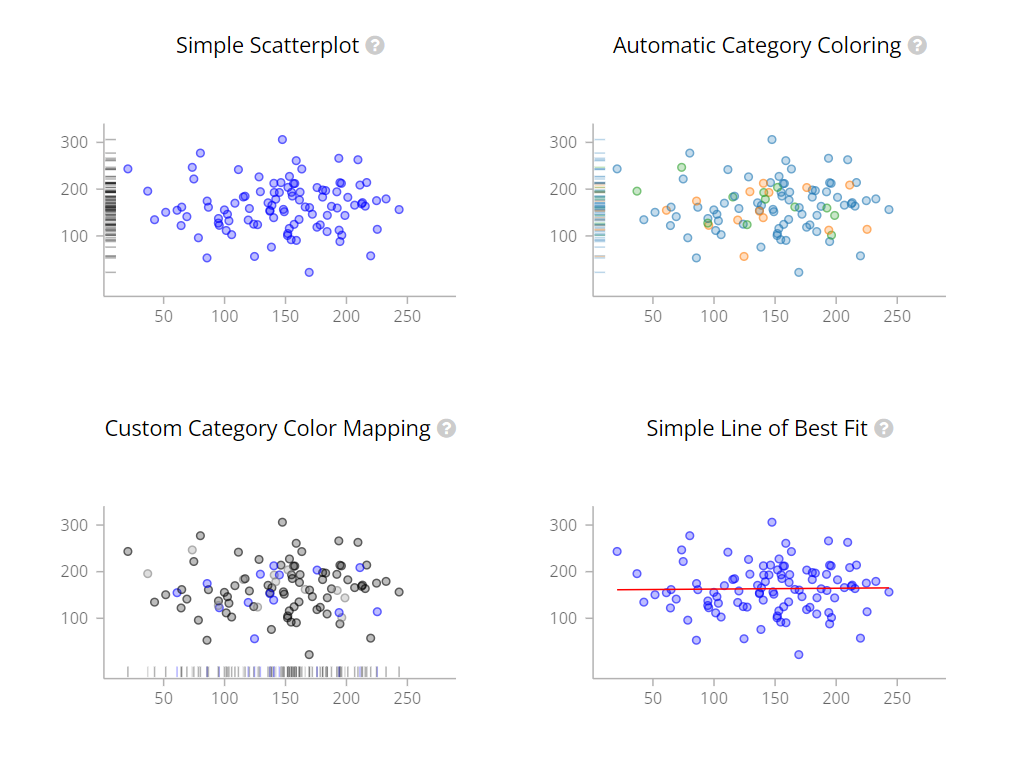
MetricsGraphics.js is a D3-based library optimized for visualizing and laying out time-series data. At under 80KB (minified), it enables the production of common types of graphics in a principled, consistent, and responsive manner. It currently supports Line charts, scatterplots, histograms, bar charts, and data tables, as well as features such as rug plots and basic linear regression.
The library’s aim is to take mystery and complication out of presenting simple data with an emphasis on efficiency and practicality.
**Development setup:***Make sure you have yarn installed*

#* clone and setup*
$ git clone [https://github.com/metricsgraphics/metrics-graphics](https://github.com/metricsgraphics/metrics-graphics)
$ cd metrics-graphics
$ yarn install
5. Charts.js
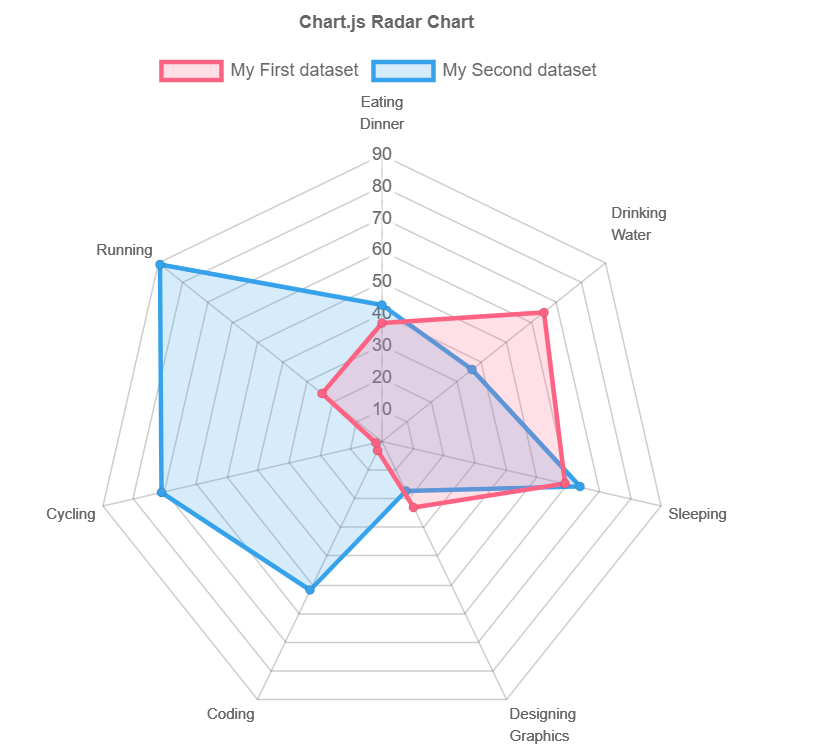
Chart.js is an open-source and community-maintained JavaScript library for making HTML-based charts. It is an easy way to include animated and interactive graphs on your website. It is one of the simplest visualization libraries for JavaScript. You can visualize your data in 8 different ways:
-
Scatter Plot
-
Line Chart
-
Bar Chart
-
Pie Chart
-
Donut Chart
-
Bubble Chart
-
Area Chart
-
Radar Chart
-
Mixed Chart
**Installation: **$ npm i chart.js
Here’s the detailed documentation for you to get started.
6. Paper.js
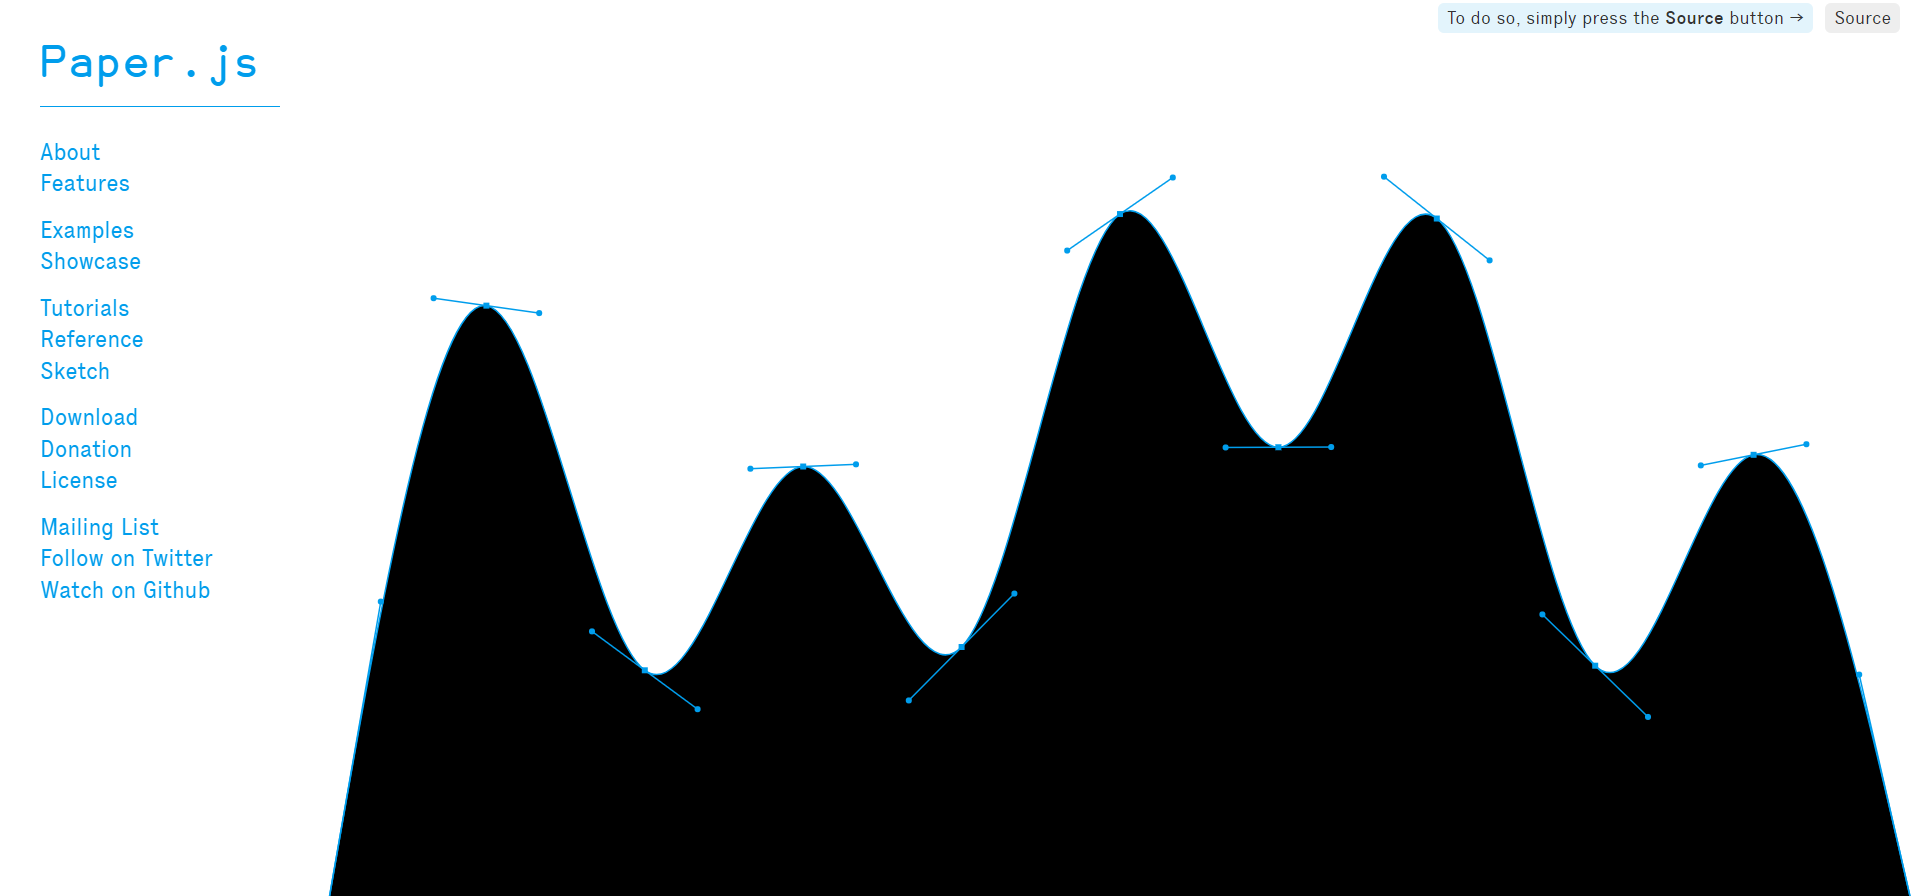
Paper.js is a vector graphics scripting framework that runs on top of HTML5 Canvas. It provides a clean Scene Graph / Document Object Model as well as a lot of powerful functionality for creating and manipulating vector graphics and bezier curves, all neatly wrapped up in a well-designed, consistent, and clean programming interface.
Paper.js is easy to learn for beginners and has lots to master for intermediate and advanced users.
**Installation**: $ npm install paper
You can learn more about Paper.js here.
7. Fabric.js
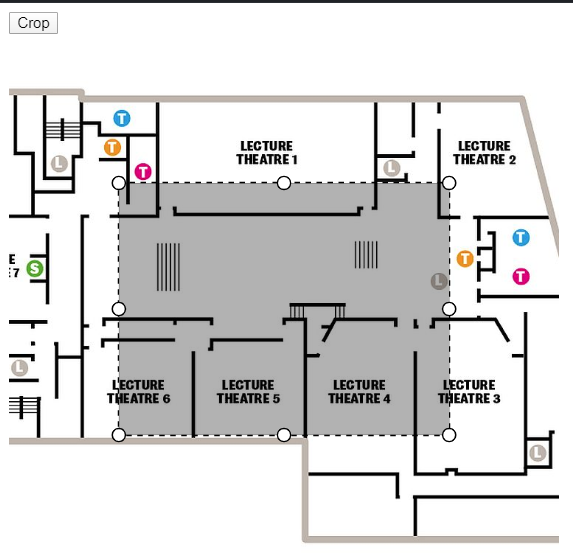
Fabric.js is a framework that makes working with the HTML5 canvas element simple and easy. It is a canvas element with an interactive object model on top of it. It also functions as an SVG-to-canvas parser.
You can use Fabric.js to create and populate canvas objects such as simple geometrical shapes — rectangles, circles, ellipses, polygons — or more complex shapes made up of hundreds or thousands of simple paths. You can then use the mouse to scale, move, and rotate these objects, as well as change their properties (color, transparency, z-index, and so on). You can also manipulate these objects as a group by selecting them with the mouse.
**Installation**: $ npm install fabric — save
Here’s detailed documentation for Fabric.js.
8. Raphaël
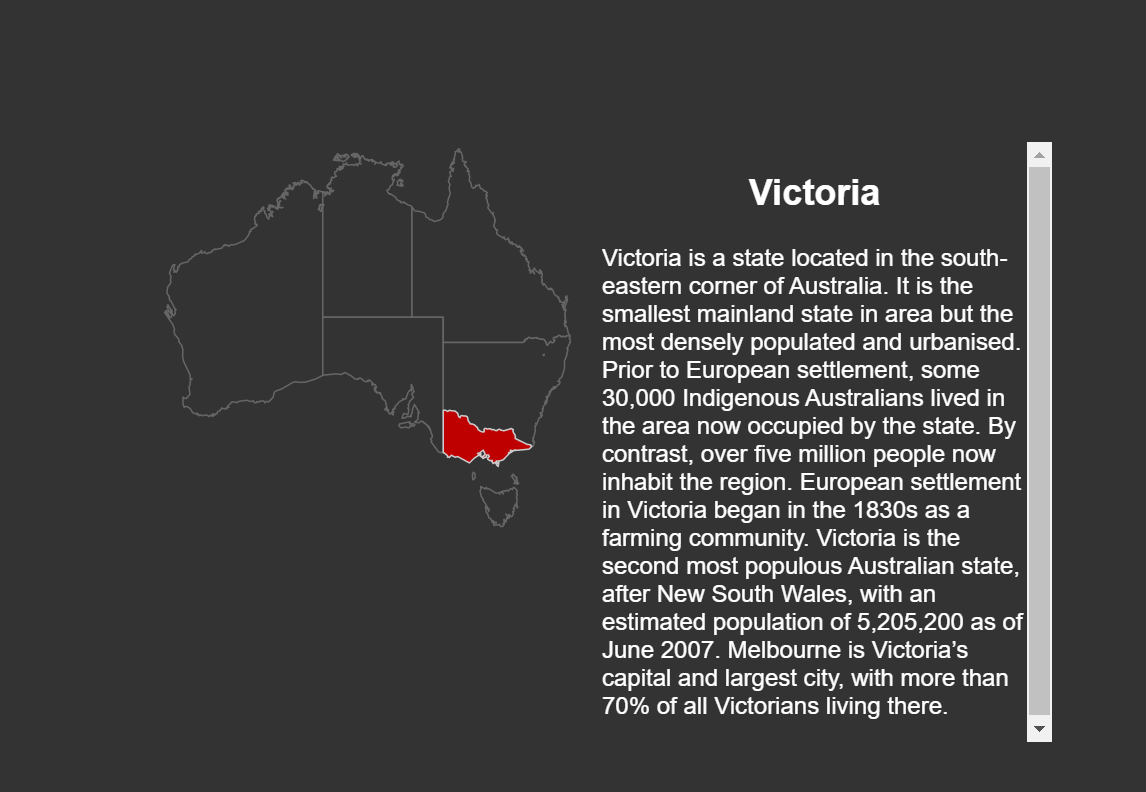
Raphaël is a small JavaScript library that should make working with vector graphics on the web easier. If you want to make your own custom chart or image crop and rotate widget, you can do so quickly and easily with this library.
Raphaël currently supports Firefox 3.0+, Safari 3.0+, Chrome 5.0+, Opera 9.5+ and Internet Explorer 6.0+. It uses the SVG W3C Recommendation and VML as a base for creating graphics. This means every graphical object you create is also a DOM object, so you can attach JavaScript event handlers or modify them later.
**Installation:
**$ git clone [https://github.com/DmitryBaranovskiy/raphael.git](https://github.com/DmitryBaranovskiy/raphael.git)
$ yarn install --frozen-lockfile
$ yarn build-all
To run tests you need to run npx bower install open dev/test/index.html in your browser, there's no automated way right now.
Here’s the detailed Raphaël documentation.
9. Apache ECharts
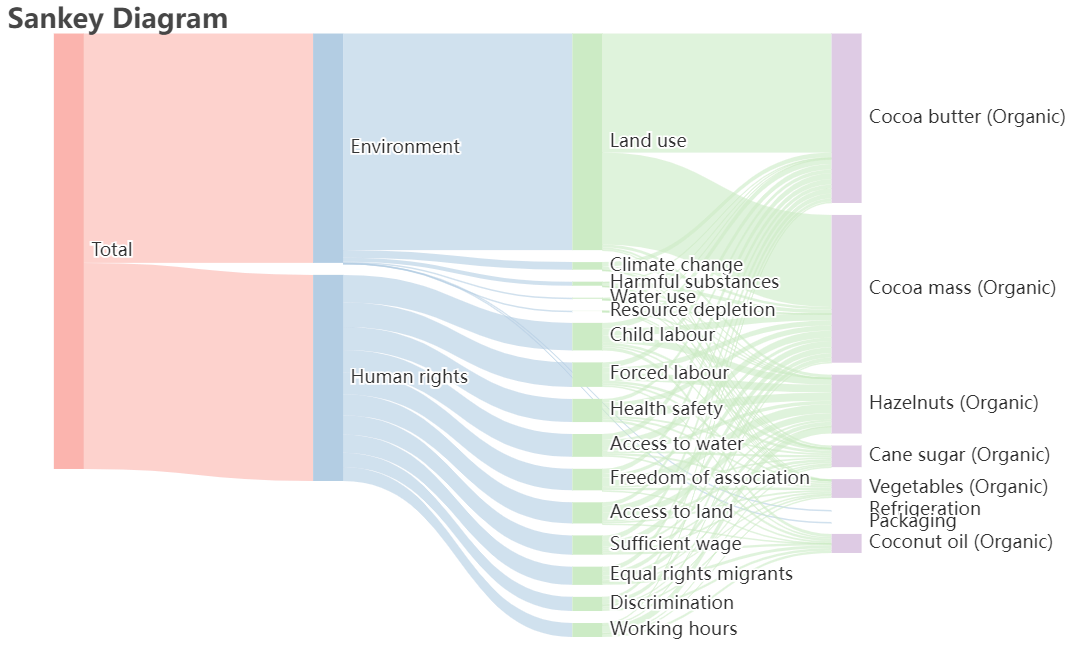
Apache ECharts is an open-source JavaScript data visualization library. It is a free, powerful charting and visualization library offering an easy way of adding intuitive, interactive, and highly customizable charts to your commercial products. It provides more than 20 chart types available out of the box, along with a dozen components, and each of them can be arbitrarily combined to use.
You can manage data through datasets, which support data transforms like filtering, clustering, and regression to help analyze the multi-dimensional analysis of the same data.
**Installation**: npm install echarts --save
Here’s the detailed documentation for Apache ECharts.
10. Vis.js
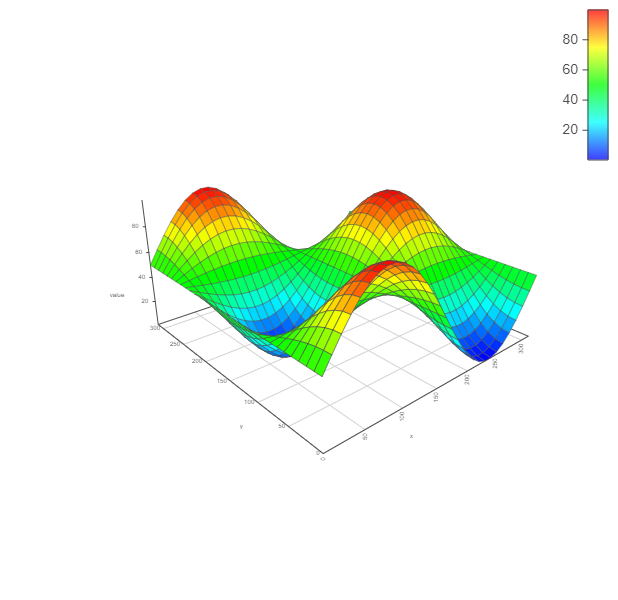
Vis.js is a dynamic, browser-based visualization library. It is designed to be as easy as possible to use while at the same time being capable of handling large amounts of dynamic data to enable manipulating and interacting with the data. The library consists of the components DataSet, Timeline, Network, Graph2d, and Graph3d.
Installation:
#vis-network
$ npm install vis-network

#vis-timeline
$ npm install vis-timeline

#vis-graph3d
$ npm install vis-graph3d
Learn more about vis.js here.
11. Sigma.js
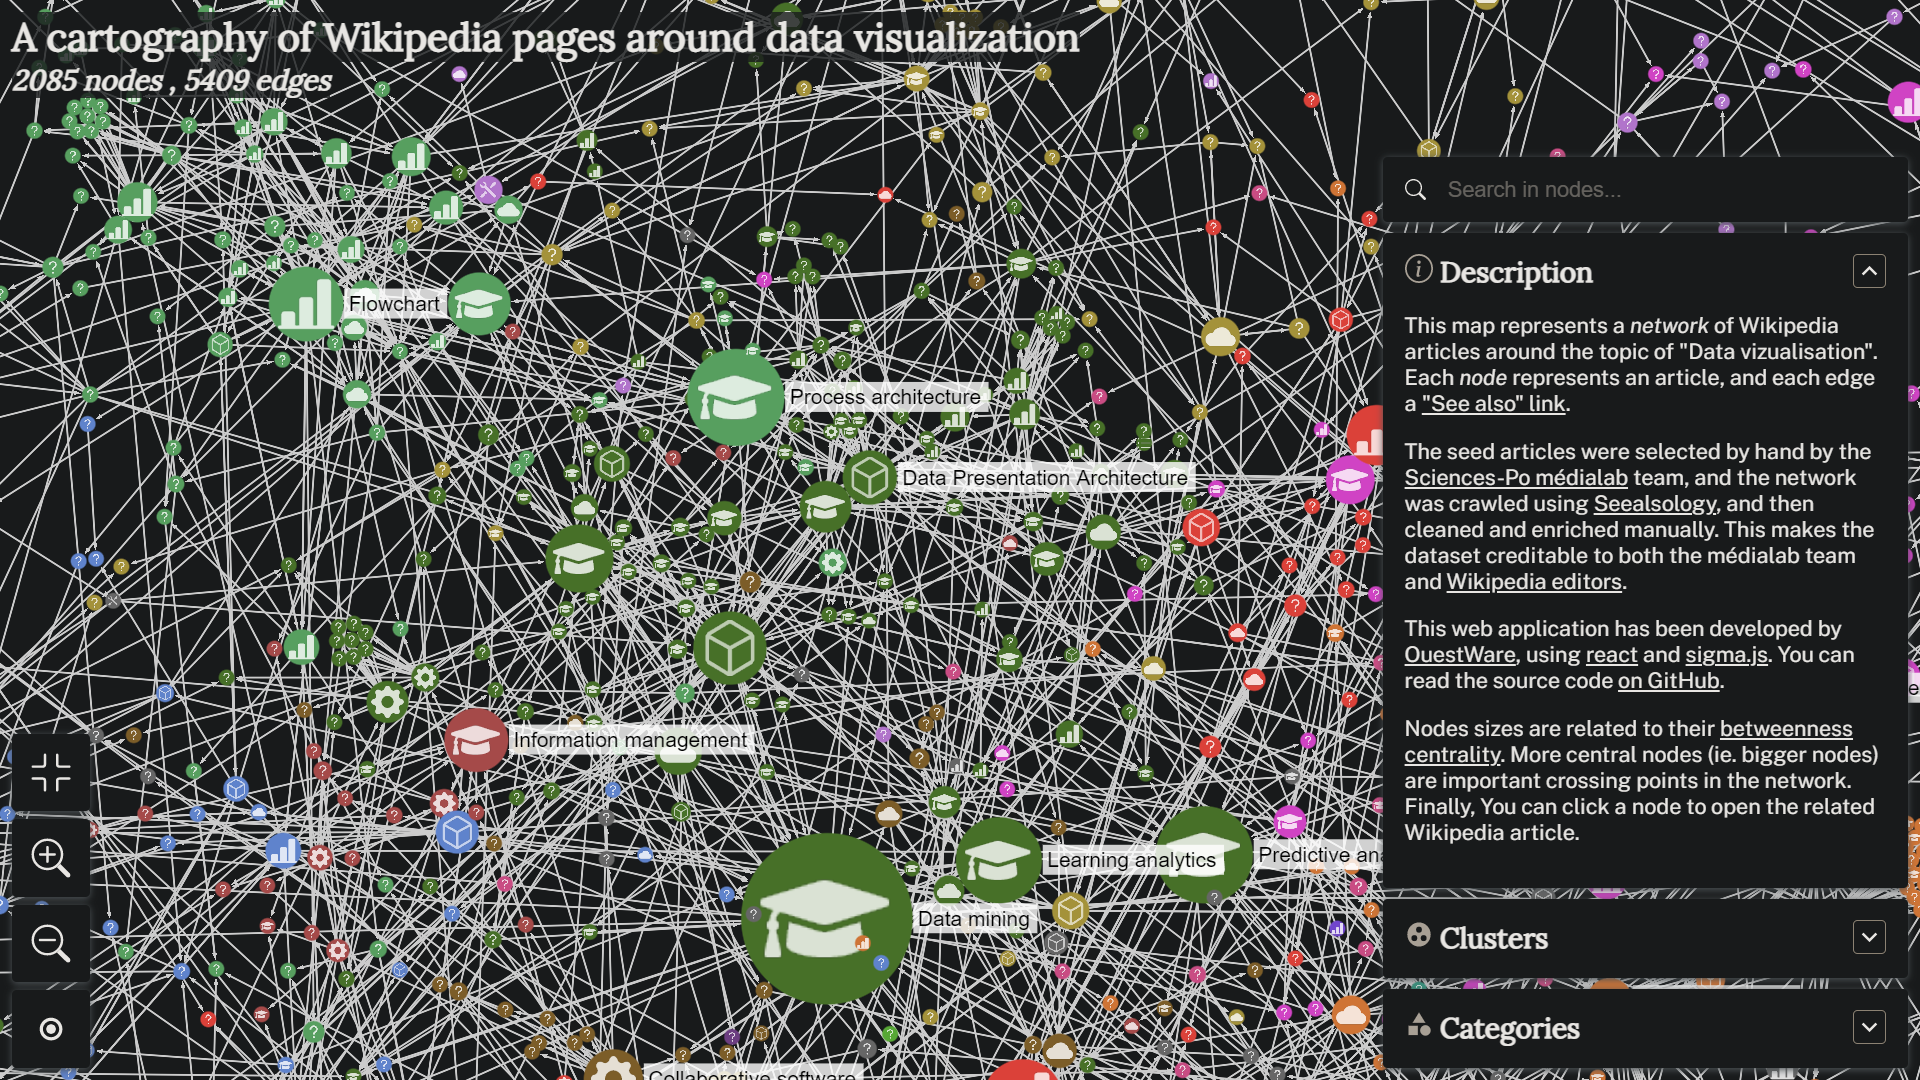
Sigma.js is a modern JavaScript library for rendering and interacting with network graphs in the browser. It works in symbiosis with graphology, a multipurpose graph manipulation library. Sigma.js renders graphs using WebGL. It allows drawing larger graphs faster than with Canvas or SVG-based solutions.
**Installation: **$ npm install graphology sigma
Learn more about Sigma.js here.
12. Arbor.js
Arbor is a graph visualization library built with web workers and jQuery. Rather than trying to be an all-encompassing framework, arbor provides an efficient, force-directed layout algorithm plus abstractions for graph organization and screen refresh handling.
It leaves the actual screen drawing to you. This means you can use it with canvas, SVG, or even positioned HTML elements; whatever display approach is appropriate for your project and your performance needs.
**Installation:**

To use the particle system:

  <script src="path/to/jquery.min.js"></script>
  <script src="path/to/arbor.js"></script>

If you want to let arbor handle realtime color and value tweens for
you, include the arbor-tween.js file as well:

  <script src="path/to/jquery.min.js"></script>
  <script src="path/to/arbor.js"></script>
  <script src="path/to/arbor-tween.js"></script>
Learn more about arbor.js here.
13. Vega
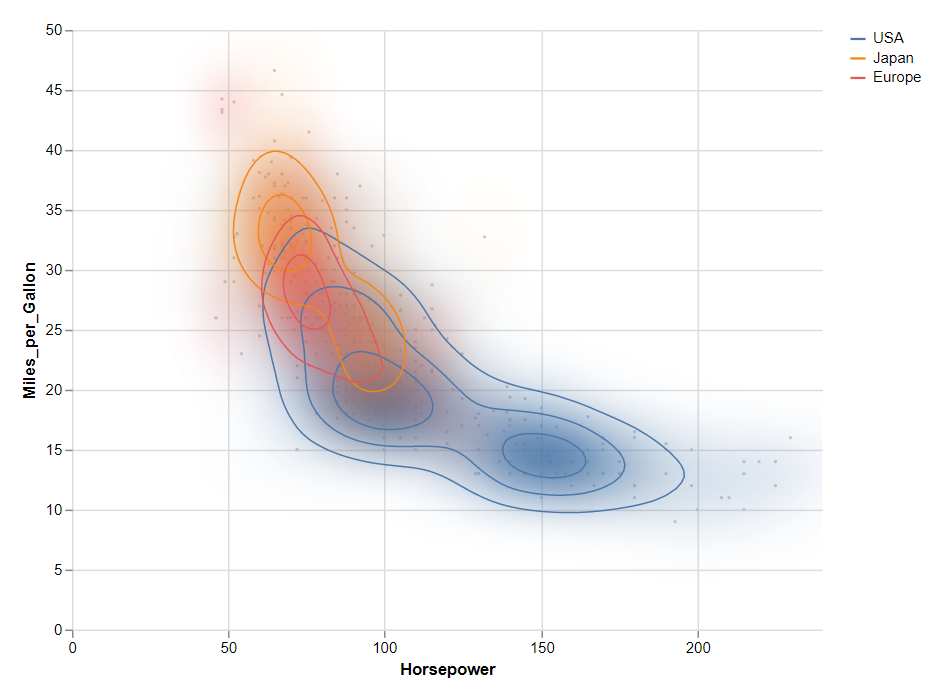
Vega is a visualization grammar, a declarative language for creating, saving, and sharing interactive visualization designs. With Vega, you can describe the visual appearance and interactive behavior of a visualization in a JSON format, and generate web-based views using Canvas or SVG.
Vega provides basic building blocks for a wide variety of visualization designs: data loading and transformation, scales, map projections, axes, legends, and graphical marks such as rectangles, lines, plotting symbols, etc.
**Installation: **$ npm install vega
Here’s the detailed documentation for Vega.
14. Envision.js
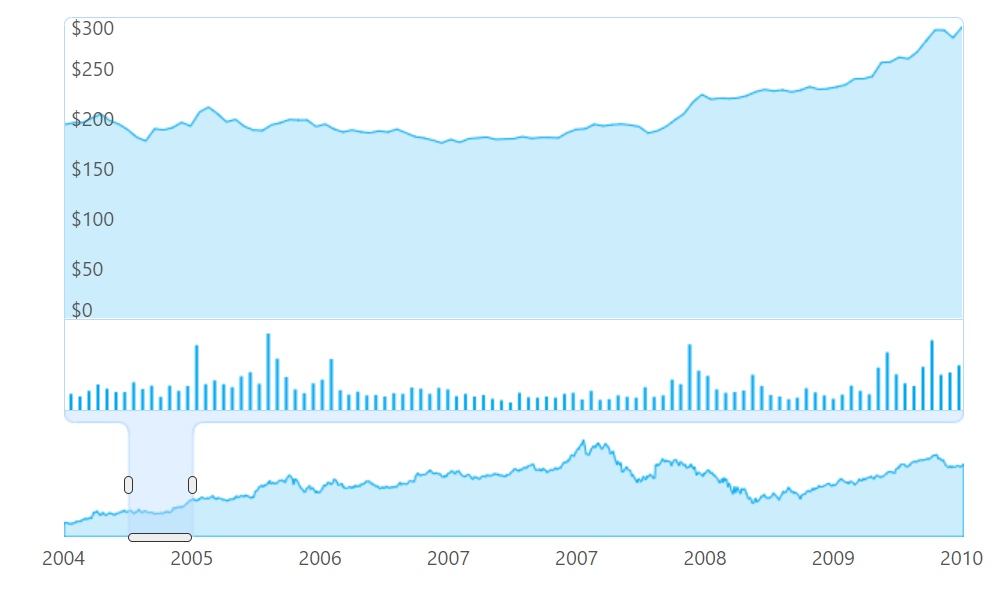
Envision.js is a library for creating fast, dynamic, and interactive HTML5 visualizations.
Features:
-
Modern Browsers, IE 6+
-
Touch / Mobile Support
-
HTML5 Finance Chart
-
HTML5 Time Series Chart
-
API for Custom Visualizations
-
Framework Agnostic
-
Adapted to Flotr2
-
Adaptable to Others
To use Envision.js, include envision.min.js and envision.min.css in your page. To display a visualization, either use a Template or create a custom visualization with the Envision.js API.
Envision.js documentation.
15. Rickshaw
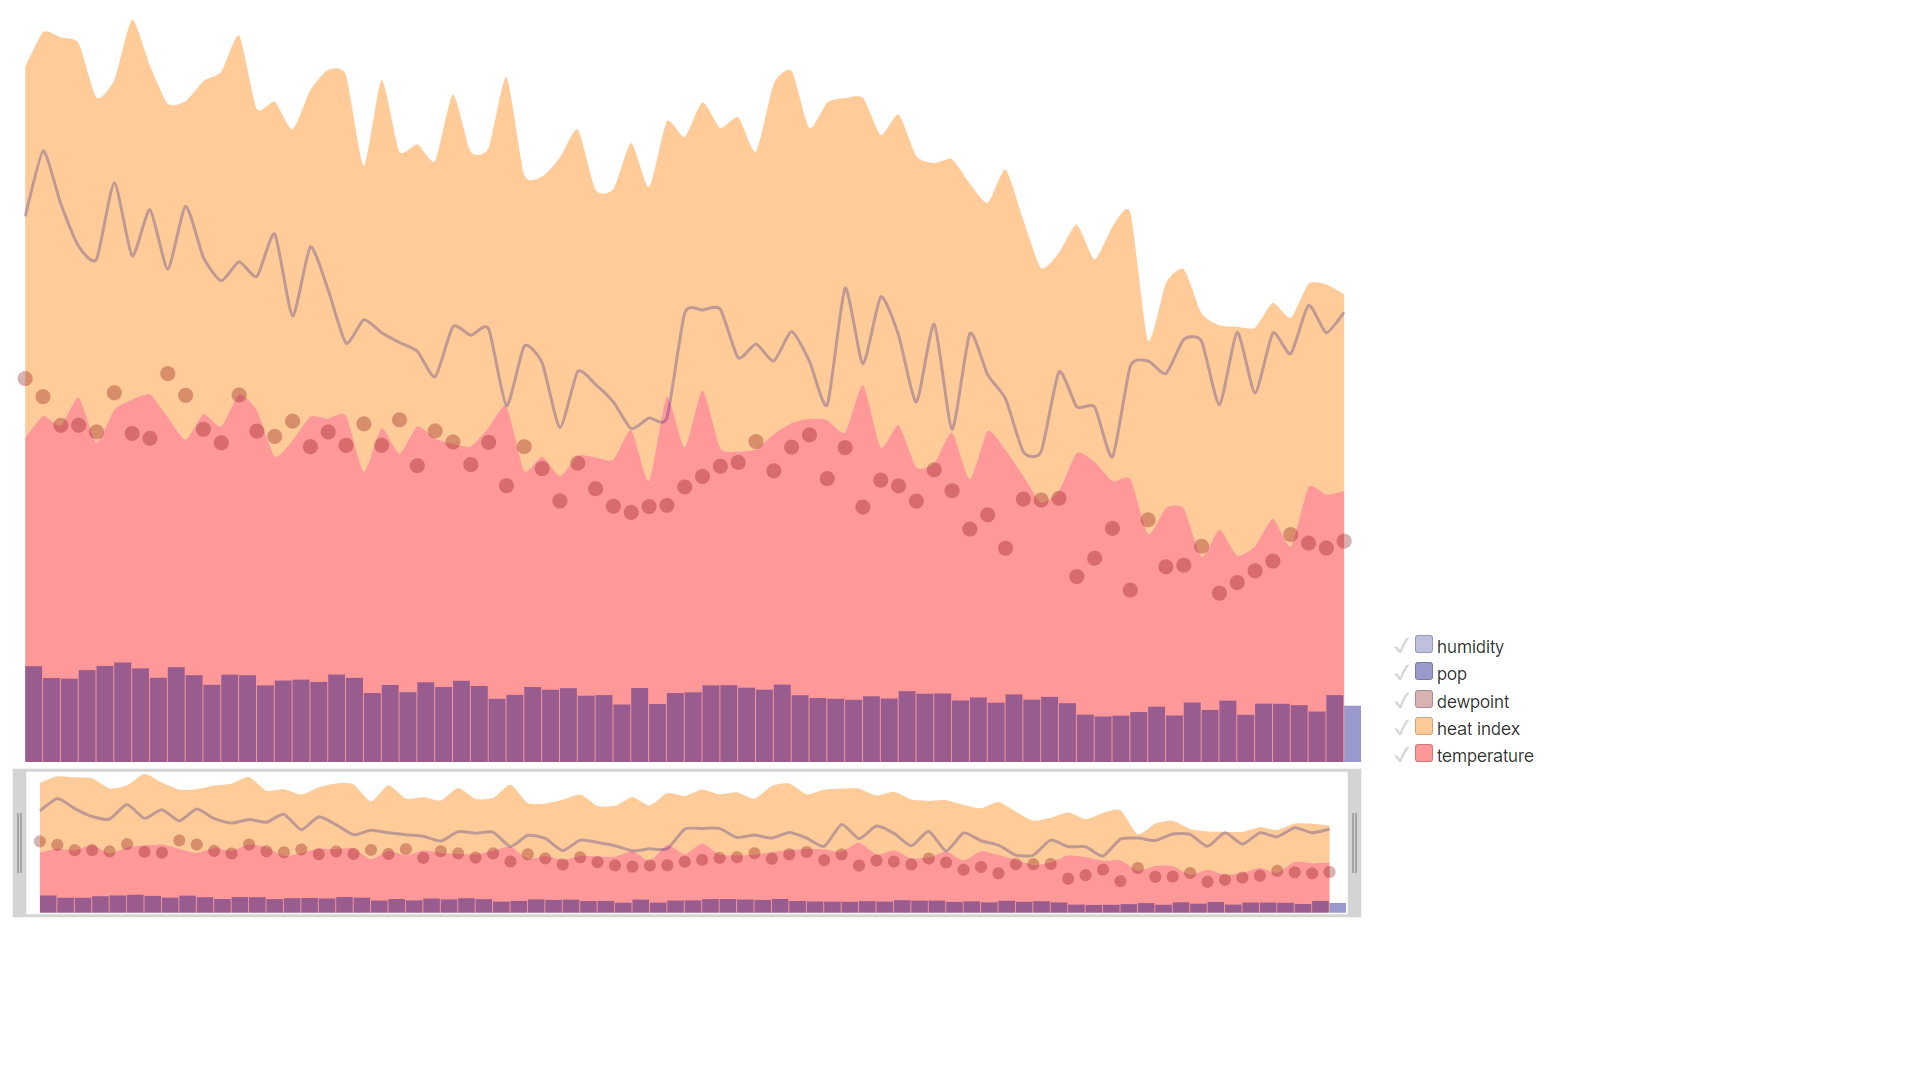
Rickshaw is a free and open-source JavaScript toolkit for creating interactive time-series graphs. Rickshaw provides the elements you need to create interactive graphs: renderers, legends, hovers, range selectors, etc. It’s all based on d3 underneath, so graphs are drawn with standard SVG and styled with CSS. You can customize all you like with techniques you already know.
**Installation:** npm install --save rickshaw
You can learn Rickshaw from official tutorials here.
16. dc.js
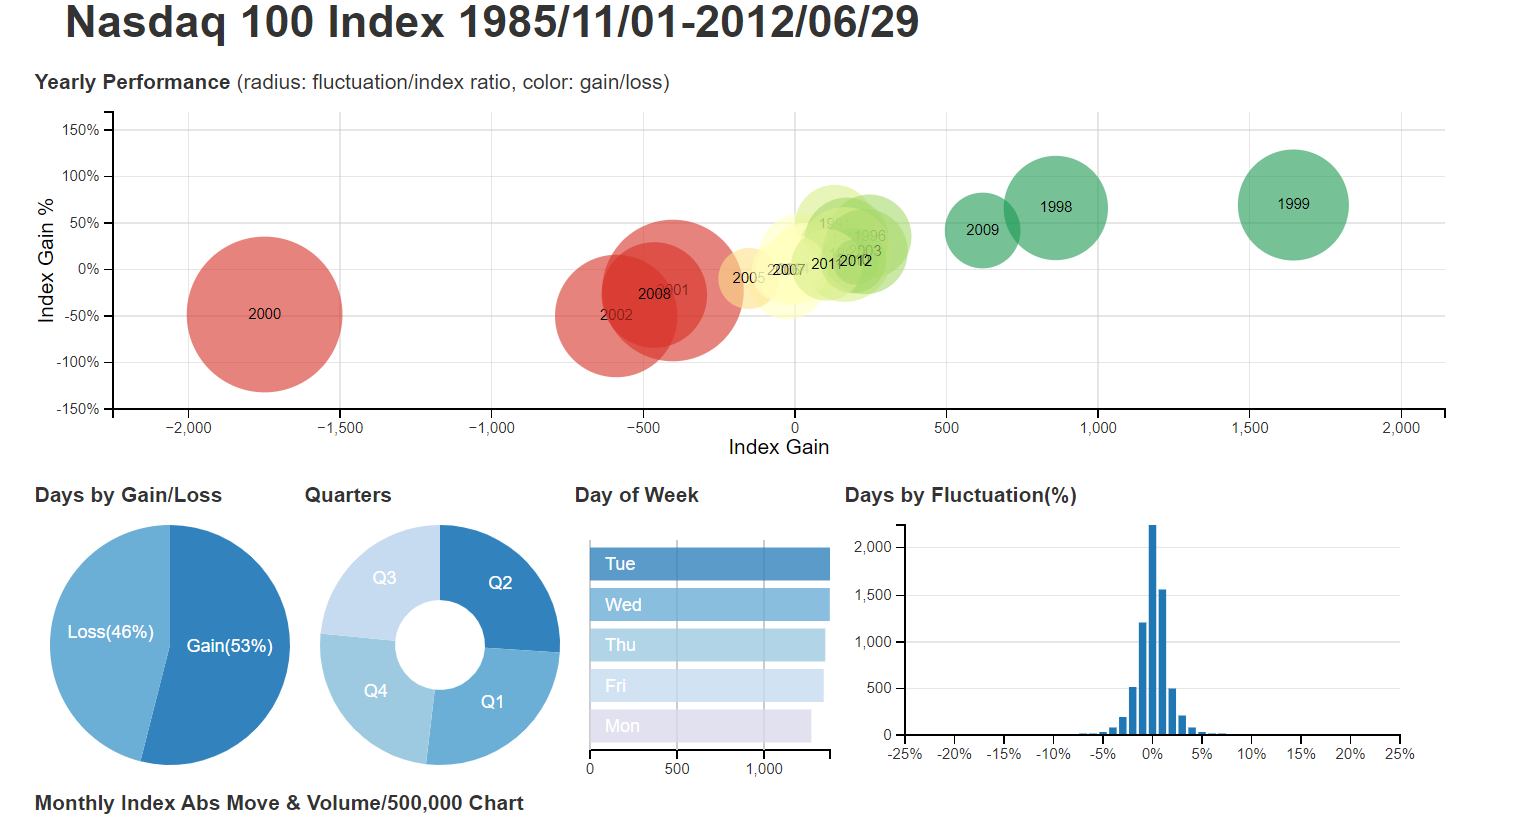
dc.js is an easy yet powerful javascript library for data visualization and analysis in the browser and on mobile devices. dc.js allows highly efficient exploration of large multi-dimensional datasets and it leverages d3 to render charts in CSS-friendly SVG format. Charts rendered using dc.js are data-driven and reactive and therefore provide instant feedback to user interaction.
In dc.js, each chart displays an aggregation of some attributes through the position, size, and color of its elements, and also presents a dimension that can be filtered. When the filter or brush changes, all other charts are updated dynamically, using animated transitions.
**Installation: **$ npm install dc
17. SVG.js
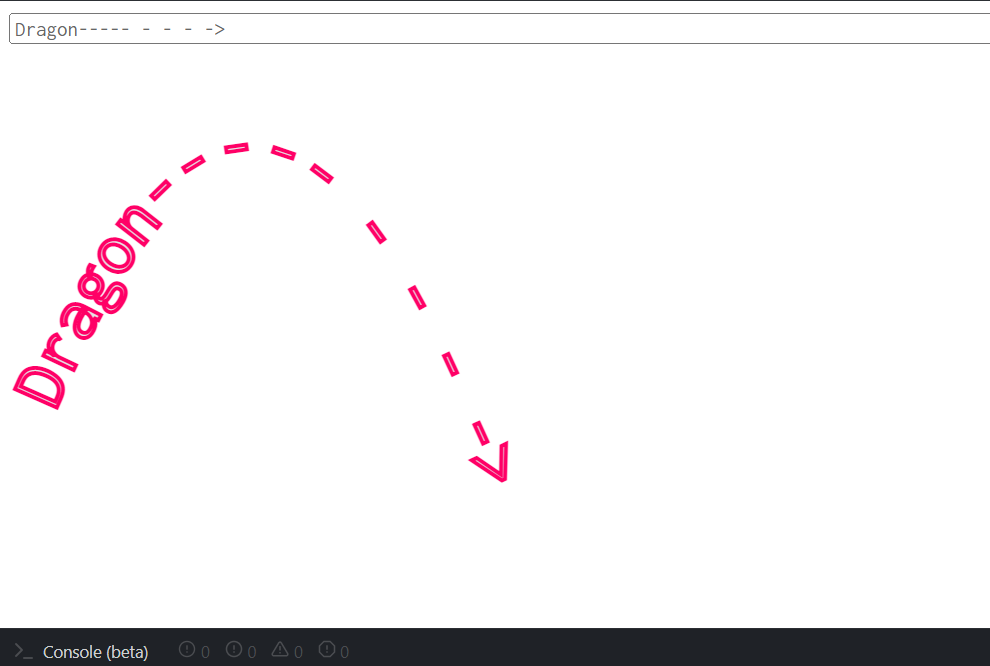
SVG.js is a fast and lightweight library for manipulating and animating SVG. SVG.js has no dependencies and aims to be as small as possible while providing close to complete coverage of the SVG spec. It provides a syntax that is concise and easy to read.
**Installation:** npm install @svgdotjs/svg.js
SVG.js documentation.
18. Heatmap.js
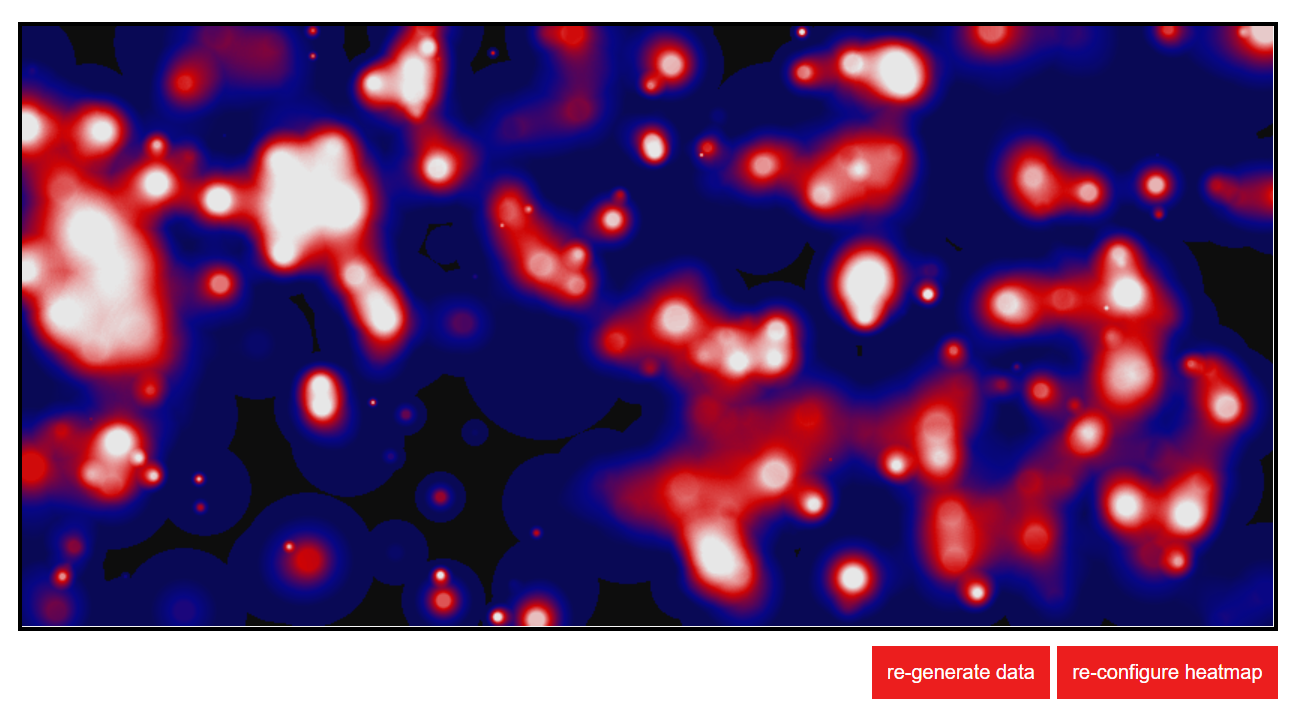
Heatmap.js is a lightweight, easy-to-use JavaScript library to help you visualize your three-dimensional data. It has a light footprint (~3kB gzip) and with the new 2.0 release heatmap.js. With its rendering module, you can handle even more datapoints.
Heatmap also gives us the independence to use different map libraries, such as Leaflet and Google Maps. With only a few lines of code, you can create your own interactive web heatmap.
**Installation:** $ npm install heatmap.js
Here’s the heatmap.js documentation.
19. Trianglify
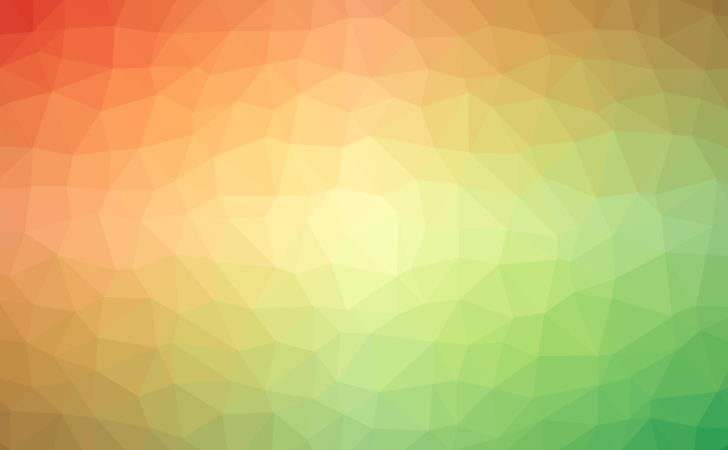
Trianglify is an open-source JavaScript library for creating unique, aesthetically pleasing triangle SVG background image patterns. It generates low-poly style patterns by combining a Delaunay triangulation with some nice colors like the one above.
You can generate Trianglify patterns without writing a single line of code at Trianglify.io.
**Installation: **$ npm install --save trianglify
You can learn more about Trianglify here.
20. Dimple.js
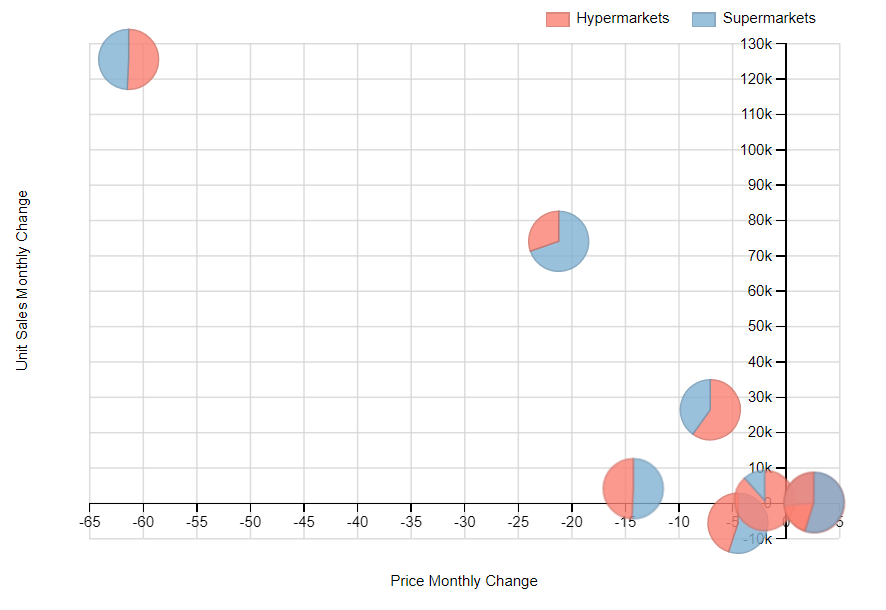
Dimple is an object-oriented API that allows you to use d3.js to create flexible axis-based charts.
This project’s goal is to enable analysts who aren’t necessarily expert JavaScript programmers to create standard (and some not-so-standard) business analytics.
The API will also expose the core d3 objects where possible, allowing users to extend the base functionality in any way they see fit as they gain confidence.
**Installation: **$ npm i dimple-js
Here’s the full Dimple documentation.
21. Chartist.js
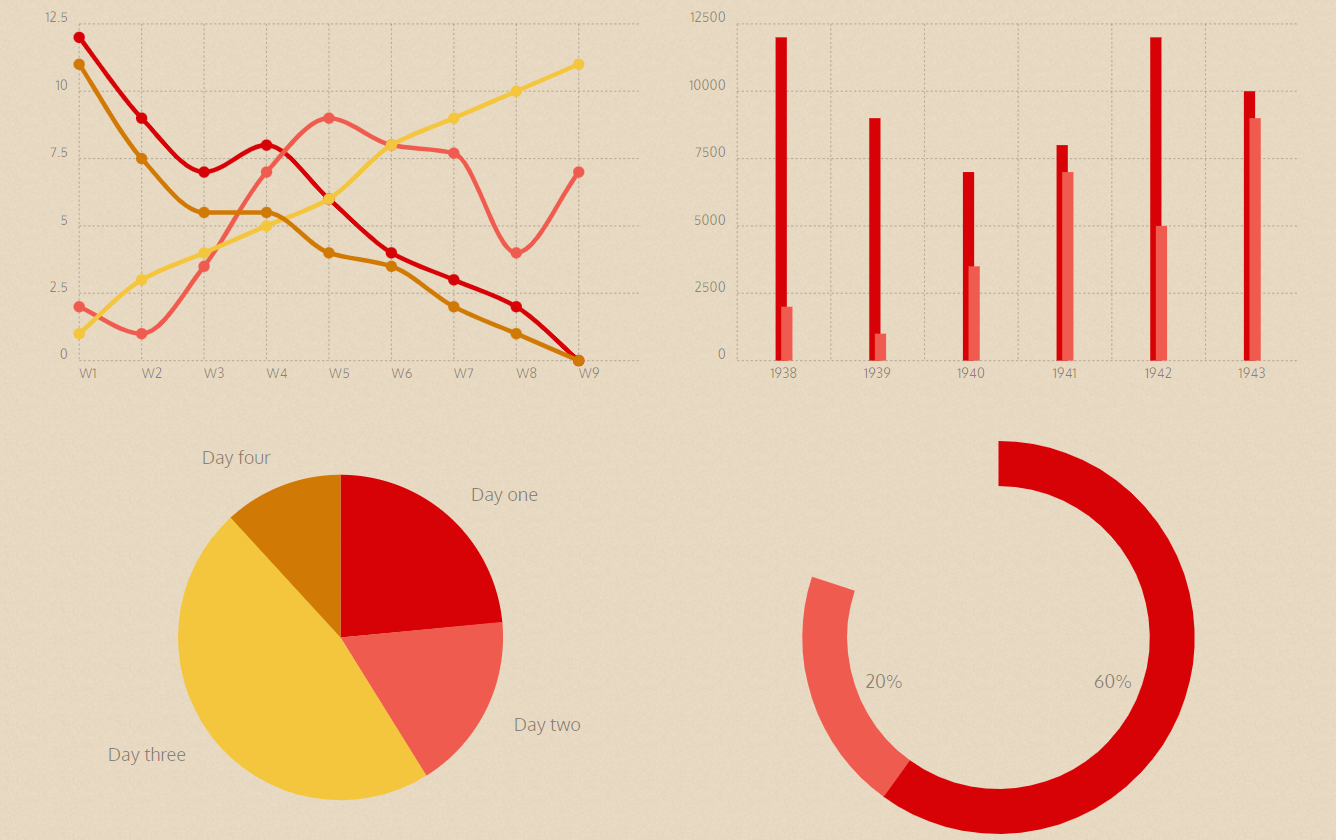
Chartist.js is a simple responsive charting library built with SVG. Its goal is to provide a simple, lightweight, and unintrusive library to responsively craft charts on your website.
Because Chartist uses inline-SVG, it takes advantage of the DOM to deliver some of its features. This also implies that Chartist does not include event handling, labels, behaviours, or anything else that can be accomplished using simple HTML, JavaScript, and CSS.
**Installation: **$ npm i chartist
Here’s the link to Chartist.js documentation.
22. Epoch

Epoch is a general-purpose real-time charting JavaScript library for building beautiful, smooth, and high-performance visualizations. It features five beautiful and high-performance real-time charts built using d3 & Canvas.
It mainly focuses on two types of visualisation programming: basic charts for constructing historical reports and real-time charts for displaying data that is constantly changing.
**Installation: **$ npm i epoch-charting
Here’s a link to the getting started guide for Epoch.
23. Babylon.js
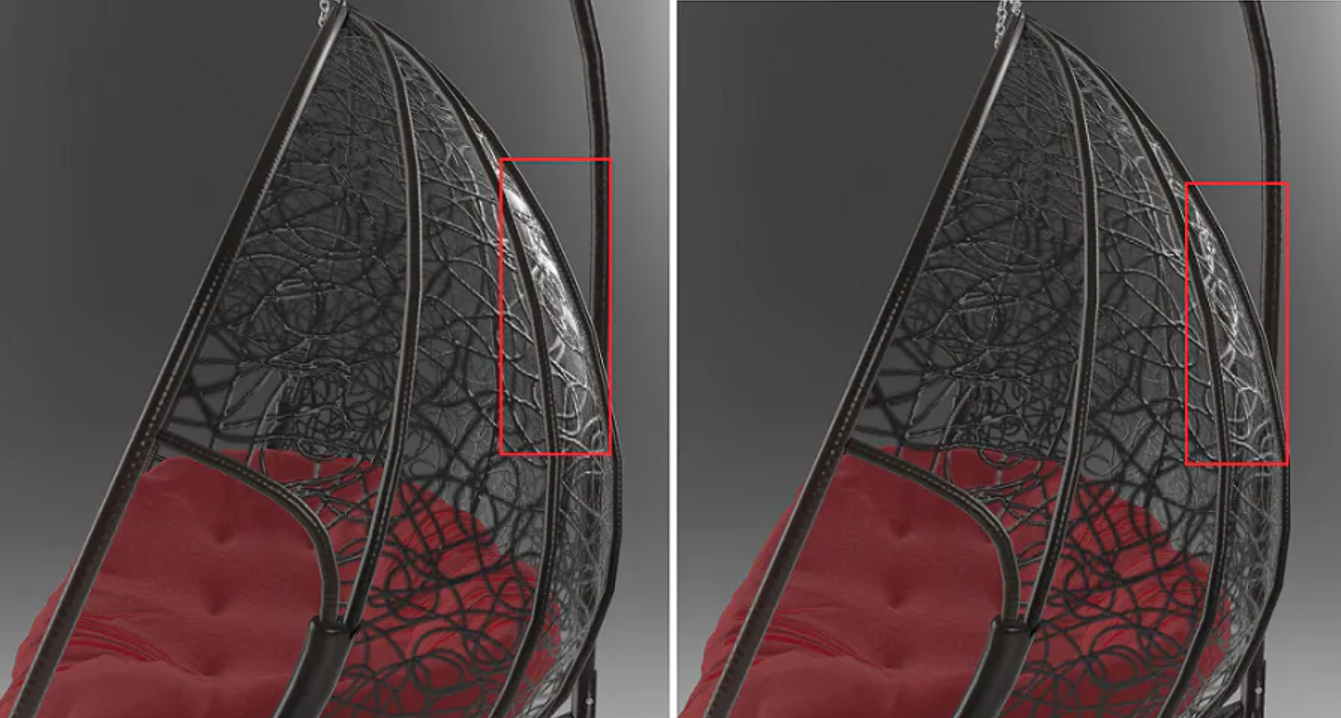
Babylon.js is a free and open-source library. It is a powerful, beautiful, and also a simple JavaScript Framework. It’s a real-time 3D engine that uses a JavaScript library to render 3D visuals in a web browser using HTML5.
You can play directly with the Babylon.js API using playground. It also contains a lot of samples to learn how to use it.
**Installation:** $ npm install babylonjs --save
Here’s the link for complete documentation.
24. Recharts
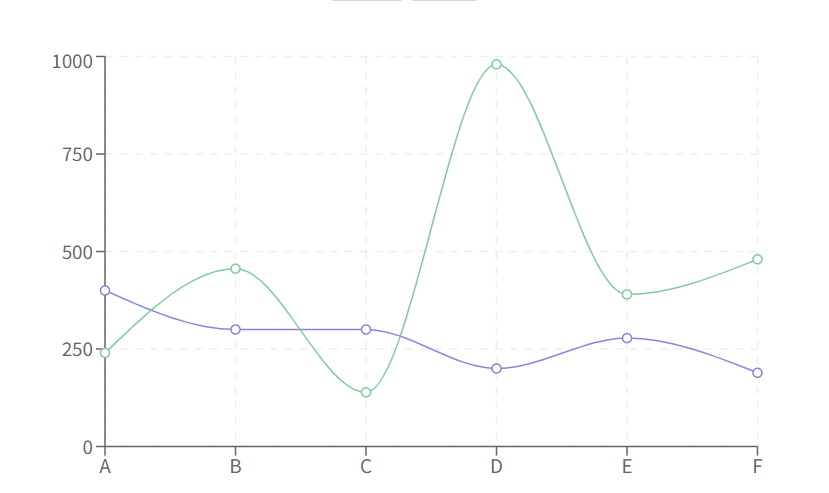
Recharts is a Redefined chart library built with React and D3. You can quickly build your charts with decoupled, reusable React components. It is built on top of SVG elements with a lightweight dependency on D3 submodules. You can customize your chart by tweaking component props and passing in custom components.
**Installation: **$ npm install recharts
25. GraphicJS
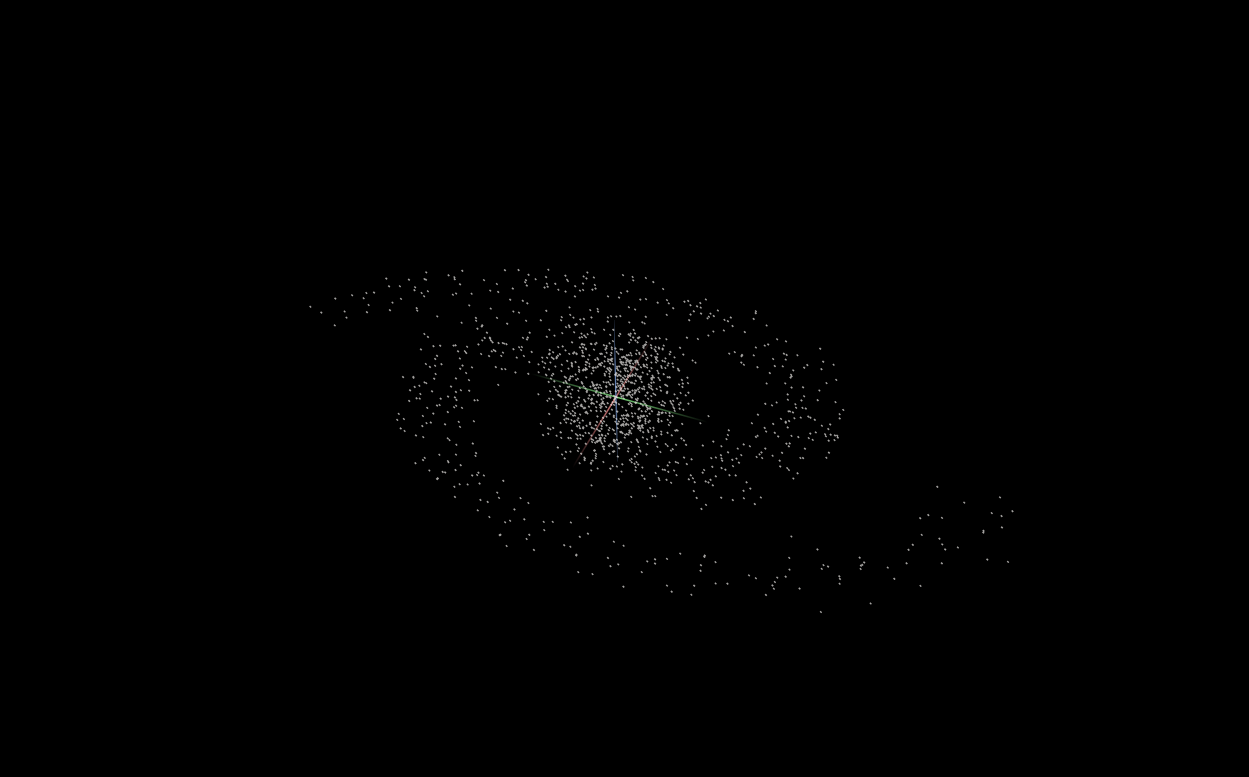
GraphicsJS is a lightweight JavaScript graphics library that allows you to draw absolutely anything, including any sort of interactive and animated graphics with any visual effects. You can use it for data visualization, charting, game design, or anything else.
GraphicsJS allows to visualize complicated mathematical algorithms very conveniently and easily. It has one of the most powerful line drawing features among SVG/VML-based graphics libraries that provide only Bezier curves out of the box.
You can download GraphicJS from here.
Here’s the link to full documentation for GraphicJS.
26. G2

G2 is a data-driven visualisation grammar with a high level of usability and scalability. It includes a collection of grammar that allow users to move beyond a limited range of charts and into a nearly limitless realm of graphical representations. With G2, you can construct web-based views using Canvas or SVG and describe the visual appearance and interactive behaviour of a visualisation with only one sentence.
27. G2 Plot
G2Plot is a charting library that is both interactive and responsive. With a few lines of code and the syntax of graphics, you can simply create excellent statistics charts.
**Installation:
**# for G2
$ $ npm install @antv/g2

# for G2 Plot
$ $ npm install @antv/g2plot
Comments
Loading comments…