
Photo by Yoal Desurmont on Unsplash
Like the picture above, the journey to becoming a data scientist and reach the highest peak begins with learning to walk. You can’t start with a complicated neural network if you’ve never mastered linear regression. Come along and learn how to take those first steps. When you begin in the field of data science, there are certain milestones you have to check off of your list. Computer? Check. Programming language experience? Check. Knowledge of statistics and probability? Check. What’s next?
Well, now you need data…to you know…science.
That’s where this article comes in. I am going to show you how there are data sets that are already included in a Python package. Not only that, but I am also going to show you how to find them, what they entail, and what kind of project they would be great for.
There is a nice variety in the datasets which allows for a variety of data science techniques. But first, let’s figure out how to find them and what they are.
Importing Seaborn is the first step, inside the package are all of our data sets. Next, we call the names of those data sets and it returns a list — that looks like this.
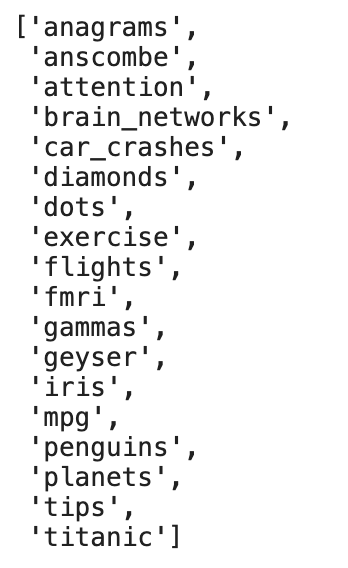
Seaborn Package Data Set Names
The image above is the list of names. There are 18 in total and each allows you to work using multiple techniques in an array of projects. However, some of them are easier to interpret than others. That is where we are going to focus on now. Let’s start with learning how to load one of these in and then we move on to an explanation and recommended projects for each.
1. Anscombe
Anscombe’s quartet is comprised of four data sets that have nearly identical simple descriptive statistics — meaning that they all have eleven points and their averages and variance are all very similar. But they all have very different distributions and appear very different when graphed. They were constructed in 1973 by the statistician Francis Anscombe to demonstrate both the importance of graphing data before analyzing it and the effect of outliers and other influential observations on statistical properties. Both of these are important ideas to a good data scientist.
When graphed, they look like this:
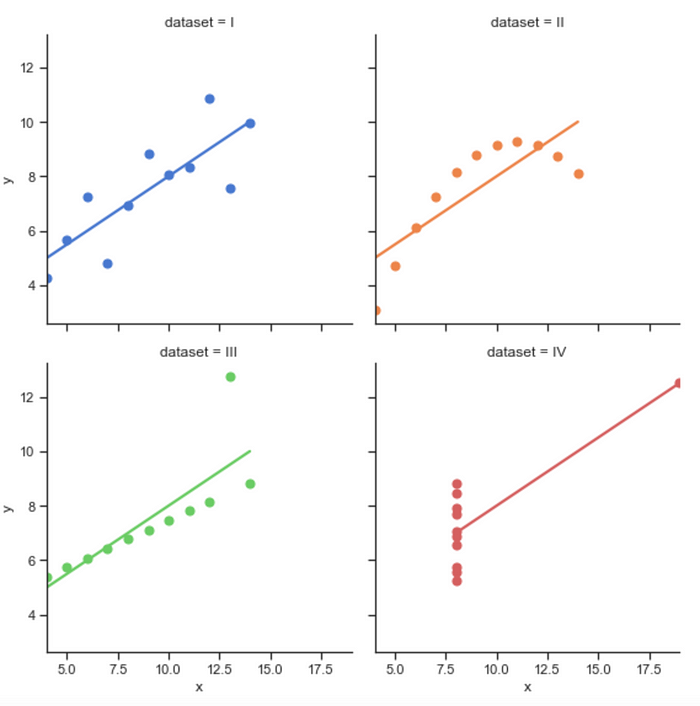
Anscombe’s Quartet Graphed
The trend lines show a striking contrast to their points. Pay close attention to how their observations form unique patterns but the trend lines are all similar.
Suggested Projects
We can do a few things here:
- Clustering — build an algorithm that can detect patterns in the data and see if there is any similarity between points in datasets I, II, III, and IV.
- Logistic Regression — try and predict which point belongs to which data set
- Linear Regression — try and predict the missing value of x or y
2. Attention
This data set is built upon test takers, whether they were focused, and what score they received. The data set looks like this:
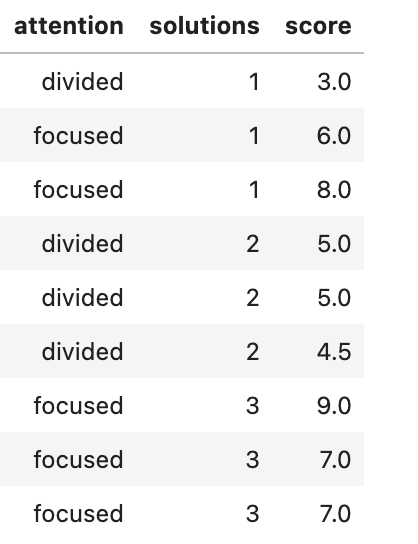
Snapshot of Data Set
The data set is pretty simple to understand. Let’s talk about projects.
Suggested Projects:
- Logistic Regression — we can try and predict whether the target variable is ‘focused’ or ‘distracted.’
3. Car Crashes
This data set is divided into different states in the U.S. Each state has the following features:
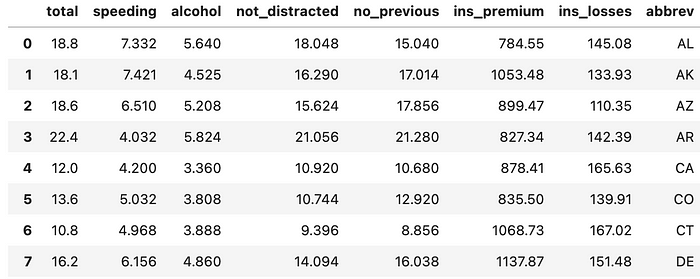
Car Crash Data Set
As you can see, the data set is flush with continuous variables. Ignoring the ‘abbrev’ feature which just tells us the state, we can use this data set to predict almost any feature.
Suggested Projects:
- Multivariate Linear Regression — using the combination of features you can try to build a model that will predict any of the features.
- Clustering — grouping states together based on the features. An interesting analysis idea would be to look at the clusters to try and determine group models using outside research (ie. traffic laws).
4. Diamonds
Let’s take a look at the data set below:
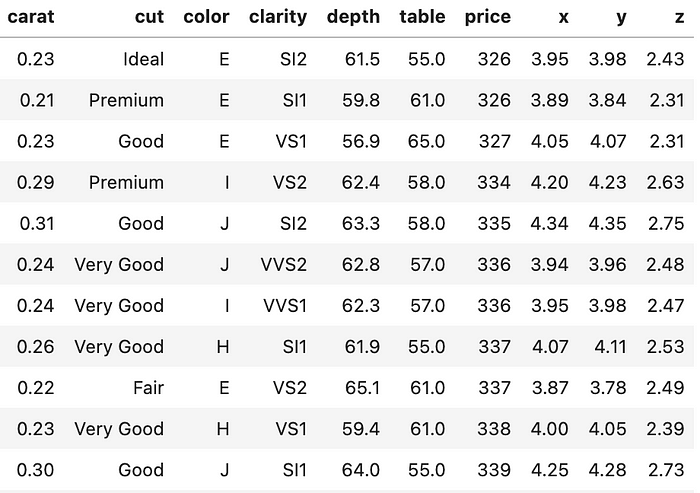
Diamonds Data Set
In this data set, each observation is a unique diamond. Features include carat, color, cut, clarity, and dimensions (x,y,z). This is a well-known beginner data set that can be used in a variety of projects.
Suggested Projects:
- Multivariate Linear Regression — there are a lot of continuous variables that could be predicted
- Multivariate Logistic Regression — try to predict either color, cut, or clarity using the other features
- Clustering — analyze clusters that come up and determine shared characteristics (ie. overpriced, fairly priced, etc)
5. Flights
This data set is the first we are going to talk about that is time-related. It looks like this:
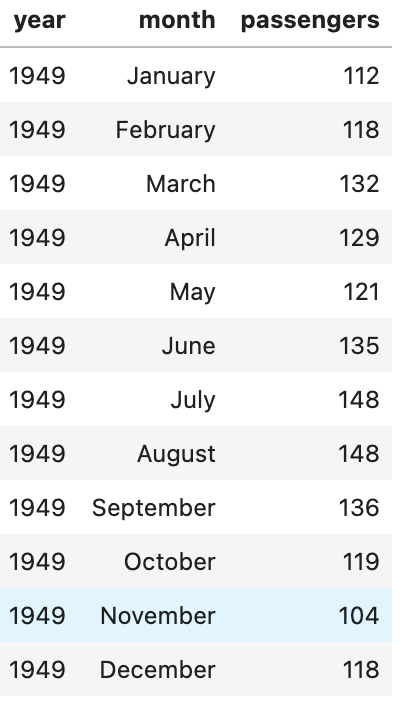
Flights Data Set
It is the monthly passenger amount from January 1949 to December 1960. With some data wrangling, you can get year and month features to combine leaving you with a nice time step.
Suggested Projects:
- Time Series — using the data, you can set out to predict the passenger at the later end of the time frame. Be careful, there is a cyclical nature to this data set.
6. Iris
The Iris data set is another fundamental data set that most of us in data science have worked with in one way or another. It contains sepal and petal dimensions for four types of iris flowers.

Iris Data Set
Suggested Projects:
- Multivariate Logistic Regression — using the dimensions above, you can try and predict the species of flower.
- Clustering — using the features, aside from species, you can try and create clusters and analyze them for patterns
7. MPG
The MPG data set is a data frame full of cars with features and names attached. As you can see below, there is a mixture of variables that can be used for regression style models.

MPG Data Set
Suggested Projects:
- Multivariate Linear Regression — trying to predict weight or displacement could be a worthwhile goal
- Multivariate Logistic Regression — the non-continuous variables include origin and model year
- Clustering — ignoring the name column, you can cluster them to determine which observations are the most similar. This would mean outside research.
8. Planets
The ‘planets’ data set is interesting if you are a fan of astronomy. It has a series of observations which are all exoplanets. Take a quick look at the data set itself:
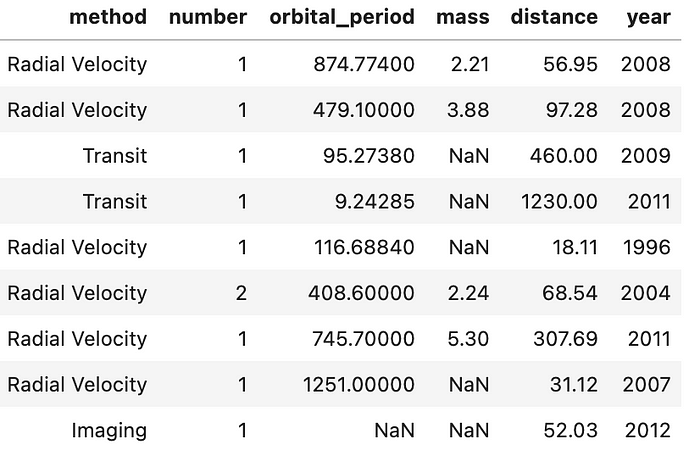
Planets Data Set
As you can see there a number of features, not all of which are easy to understand. So let’s talk about the most important features for a second.
- method — this reflects how the planet was detected. Be careful, there is a large class imbalance here.
- orbital period — how long it takes to complete one cycle of rotation around its center. Note: some are so far away from a star that it is unclear where the orbit begins, thus the NaN
- mass — relative weight of the exoplanet
- distance — light-years from Earth. If you are unfamiliar, a light-year is a distance that it takes light a year to travel. Since light is the fastest thing we know, this is a large distance. Now that you have some sort of understanding of the data set, let’s take a look at what we can do with it.
Suggested Projects:
- Logistic Regression — you can try and predict the method of detection using the other variables. Note: large class imbalance here
- Clustering — you can do a deep dive and find patterns among the exoplanets. Use different techniques like PCA to help account for variance.
- Linear Regression — you can determine whether there is a linear relationship between any of the variables and the mass of the exoplanet.
9. Titanic
This data set is the most well-known and used in my honest opinion — even the subject of an ongoing Kaggle competition. In this data set, you get a manifest of the passenger vessel that sank due to the infamous iceberg on its way from Ireland to New York City.
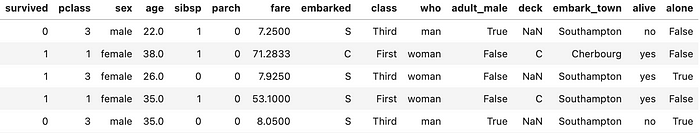
Titanic Data Set
There are many features here — whether they traveled alone, what passenger class they were in, gender, and even if they had siblings — but I will only recommend one as the target variable for tradition's sake. The survived class records whether they survived or not. It is interesting to think about the final product telling you which coefficients were most important for predicting if a person lived or died.
- Logistic Regression — looking at the ‘survived’ column, you can build a model to predict which passenger will survive and which will not. This will be a fun project and if you can master it, submit it to the Kaggle competition.
Summary
- The Seaborn Package comes with a variety of data sets
- Not all of the data sets are easily comprehended but those that are, allow for a variety of use
- Everything from time series to clustering and regressions is included
- Outside research may be required for further analysis if you’re understanding is limited (especially clustering) It may not have been clear, but clustering is a favorite of mine when it comes to modeling. The unsupervised learning technique requires you to do the analysis and explain what the model has done. This completes another entry in the data science for beginners series. If you would like to talk more about entering data science or techniques I find beneficial, you can connect with me on my LinkedIn. If you would like to have a look at my code and see what techniques I have used on my own personal projects, you can search through my repositories on Github.
Comments
Loading comments…