
Anyone playing the lottery can be carried away with fantasies about unspeakable riches and ways of spending it unspeakably fast. From a data point of view, looking into the numbers can be a fun project to practice some of the tools you have under your belt, and can actually lead to interesting experiments.
Can you predict lottery numbers? Assuming the drawings are indeed random the answer is no. Can you expect certain numbers to pop up in the future? Well, not really.
Given a large enough sample size — according to the law of large numbers — all you can expect is that the average value of the numbers drawn is going to be very close to the expected value.
Looking into what happened in the past could be still fun — if you want to choose your next winning combination, well, go ahead, build a hypothesis and find your favourites.
Let's play with historic PowerBall numbers!
The base data
We have a rather simple CSV file with the date and numbers drawn:
The first four columns are the game name and date values (M/D/Y), the next five are the “white balls” drawn, the next is the “PowerBall”, the last is the PowerPlay value. I've used the ‘names' parameter of the read_csv method to keep the column name house in order.
I would like to focus on the “white ball” numbers — this is just a decision out of convenience, the point here is to show a way to look into the data, not a comprehensive statistical analysis.
Note that since the rules of the game have changed since 2015 (the number of possible white numbers drawn have increased), I am focusing on the period after the change to avoid distortion in frequency comparison.
# Create a DateTime Series based on the Y/M/D columns
powerball_df["Date"] = pd.to_datetime(powerball_df[["Year", "Month", "Day"]])

# Put the "white ball" numbers drawn into one list
powerball_df["Nums"] = powerball_df[["Num1", "Num2", "Num3", "Num4", "Num5"]].values.tolist()

# Sort the numbers (for reading convenience, the order of draw has no on the prize)
powerball_df["Sorted_Nums"] = powerball_df["Nums"].apply(lambda x: sorted(x))

# Create 3 number combinations out of the 5 numbers drawn
powerball_df["3_Num_Combos"] = powerball_df["Sorted_Nums"].apply(lambda x: [str(list(i)) for i in combinations(x, 3)])

filtered_powerball_df = powerball_df[["Date", "Num1", "Num2", "Num3", "Num4", "Num5", "Sorted_Nums", "3_Num_Combos"]]

filtered_powerball_df = filtered_powerball_df[filtered_powerball_df["Date"] > "2015-10-07"]
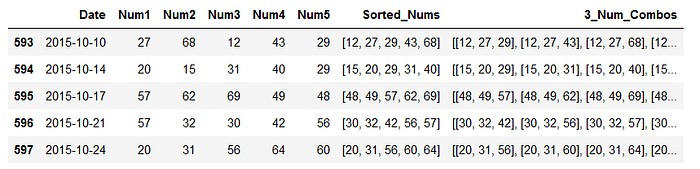
I have inserted a column where all possible 3 number combinations of a single day array are listed.
I want to look into the distribution of combinations as well, not just single numbers, and since 3 is the lowest number of matching white balls where you win a prize (without a PowerBall) I've chosen this option.
The combination method is coming from the itertools library, and it takes an iterable and integer as input: the combinations will be generated from the elements of the iterable, the integer is the number of elements in the combinations (this returns an iterator object thus the list conversion is needed to have the values).
If you would like to keep me caffeinated for creating more content like this please consider to support me, with just a coffee.

Looking at 3 number combinations
In order to analyse the distribution of 3 number combinations, we better have them in separate columns instead of in nested lists.
Now we can count the occurrences — little looping and merging can do the trick.
# Count the frequency of the 3 number pairs across the columns
combos_df = pd.DataFrame()

nums_fields = list(separated_combos.columns)
# Looping through the columns
for col in nums_fields:
	# count the number each unique value occurs in the column
	combo_counts = pd.DataFrame(separated_combos[col].value_counts())
	# If this is the first iteration, the first value_counts output will be
	# the starter DataFrame
	if combos_df.shape == (0, 0):
		combos_df = combo_counts
	else:
		# Merge the value_counts outputs along their index
		combos_df = combos_df.merge(combo_counts, how='outer', left_index=True, right_index=True)

# Sum the values in each row to get
# the total occurrence of each 3 number combination
combos_df["3_Num_Combo_Frequency"] = combos_df.sum(axis=1)
How to Join DataFrames in Python Using Pandas Merge
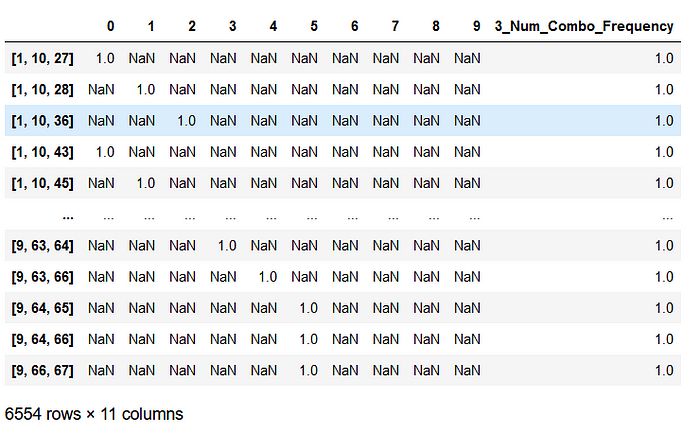
After a little more clean-up we can take a look at what we have cooked so far.
Over 6 thousand combinations have been drawn since 2015. That is a lot, however not much over 1/8 of all the possible 3 number combinations:
Screenshot by Author
This means that I have now a ton of undrawn combinations — how am I supposed to pick the most underperforming (whatever that might mean)? There is no other way out, we have to look at the individual numbers too.
Individual number frequency
We can actually use the logic written for the combinations — with slight alterations — to calculate the frequency.
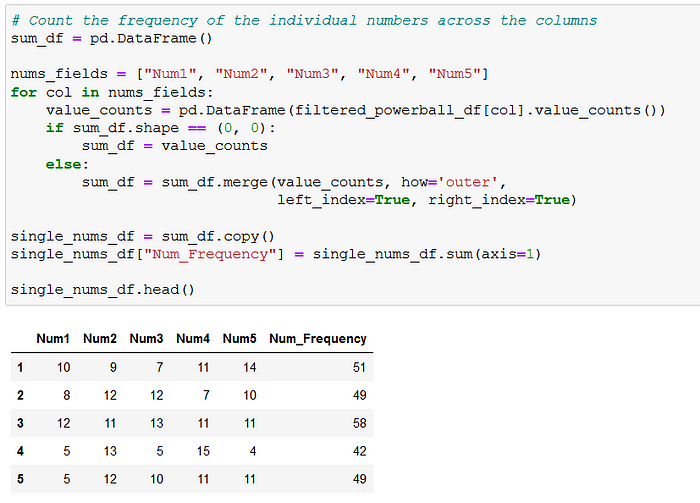
Note that here the index is the drawn number we are counting across the columns, and the values in Num1, Num2 … Num5 are the total occurrences in each column.
Combine the two frequency datasets
The logic I've followed here is the following:
-
Merge all possible 3 number combo with the ones that already have occurred,
-
Split the 3 number combinations into single number columns,
-
Merge the single number frequency data with the individual numbers from the 3 number combinations
# Merge all 3 number possible combinations with the actuals
merged_combos = all_combos_df.merge(combos_to_analyse, on='Combinations', how='outer')

# Conversion to match data types for merging
merged_combos["Combinations"] = merged_combos["Combinations"].apply(lambda x: list(x[1:-1].split(', ')))
merged_combos["Combinations"] = merged_combos["Combinations"].apply(lambda x: [int(i) for i in x])

# Split 3 number combinations into single number columns
merged_combos["Num_1"] = merged_combos["Combinations"].apply(lambda x: x[0])
merged_combos["Num_2"] = merged_combos["Combinations"].apply(lambda x: x[1])
merged_combos["Num_3"] = merged_combos["Combinations"].apply(lambda x: x[2])

# Merge single number frequency to numbers
merged_combos = merged_combos.merge(single_nums_df[["Num_Frequency"]], how='left', left_on='Num_1', right_index=True)
merged_combos = merged_combos.merge(single_nums_df[["Num_Frequency"]], how='left', left_on='Num_2', right_index=True)
merged_combos = merged_combos.merge(single_nums_df[["Num_Frequency"]], how='left', left_on='Num_3', right_index=True)

# Rename columns to keep things nice
merged_combos.fillna({"3_Num_Combo_Frequency": 0}, inplace=True)
merged_combos.rename({"Num_Frequency_x": "Num_1_Freq", "Num_Frequency_y": "Num_2_Freq", "Num_Frequency": "Num_3_Freq"}, axis=1, inplace=True)

# Sort DataFrame across frequency columns
merged_combos.sort_values(["3_Num_Combo_Frequency", "Num_1_Freq", "Num_2_Freq", "Num_3_Freq"], ascending=True)
This is the output:
This way we can create a sort-of-accurate list about the combinations really underperforming in terms of being drawn.
This is of course not a laser-precision output: look at combinations [65, 68, 69] and [65, 67, 68] for instance. [65, 67, 68] is ranked lower, however, the 3rd number frequency is actually much higher than in [65, 68, 69].
This is because of the multi-column sorting: if we changed the ordering in the sort_values method the results would be slightly different. We could go and sum the individual number frequencies to use that as the sorting column. At this point I have no further preference in the ordering, I let you decide the next steps.
Instead of further complicating the data, let's visualize it instead!
Plotting the data
A little bit of tailoring of the single number frequency data to accommodate for this task:
I used a simple Seaborn bar plot to show all the numbers and the number of times each has been drawn. The horizontal blue line marks the average number of draws.
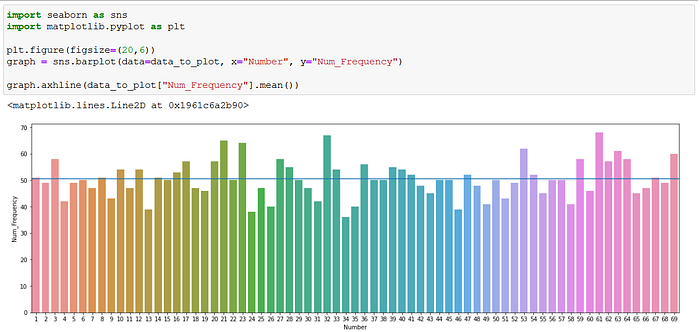
There is some noise for sure, but it looks pretty uniform if you ask me. Remember the law of large numbers I mentioned at the beginning? Even though this is not a huge sample, we can take a look at the mean of the numbers drawn:
How do we calculate the expected value of the game? Just multiply each number by the probability of being drawn in a game and sum up the products!
The difference of 0.265 is definitely not going to disprove the “law” here — but once again, under 7000 experiments are probably not considered a large number when examining the lottery.
I hope you enjoyed this poking around the lottery numbers. I think these kinds of exercises can be a good playground to practice some of the data manipulation tools you have learned with Python.
Once again, this was not an attempt to predict the future of PowerBall games in any way, I do not think that would be possible. However if you read this article and it gave you an idea to come up with an algorithm that actually can predict the numbers, well, I accept donations if you want to thank me.
Comments
Loading comments…