Better Unit Testing in Visual Studio Code with Jest
Use The Jest Extension to Dramatically Improve Your Testing Flow
 I’ve been writing unit tests with Jest for about 5–6 years now. It has always enabled me to write proper unit tests for my classes, methods, and components.
I have always run Jest through the command line in all of my projects. I set up a simple
I’ve been writing unit tests with Jest for about 5–6 years now. It has always enabled me to write proper unit tests for my classes, methods, and components.
I have always run Jest through the command line in all of my projects. I set up a simple npm test or a yarn test command when initializing the project and used that whenever I needed to spin tests manually. Additionally, the tests run in my CI/CD pipeline whenever I create a new Pull / Merge Request.
Recently, however, I discovered the VSCode Jest Extension. This extension provides a much better workflow than the command line. Let’s go through a couple of the features.
1. Automatically Start Jest Tests
If Jest is installed in the root folder of your project then this plugin will work right out of the box and will start watching for changes to run relevant tests. If you don’t have Jest installed in the root, you can easily set up a custom command through a VSCode setting in the workspace or global VSCode settings. For example:
2. Shows Individual Failed / Passed Tests
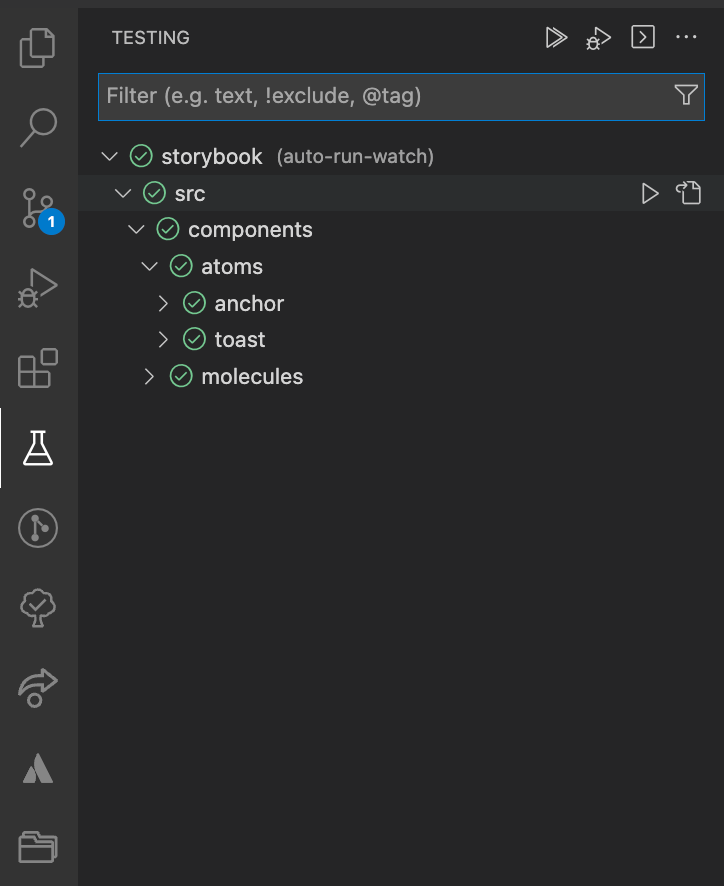
The VSCode Jest Extension provides with a visual interface within the test file on which tests are passing/failing. Additionally, you can rerun a test by clicking on the green/red icons.
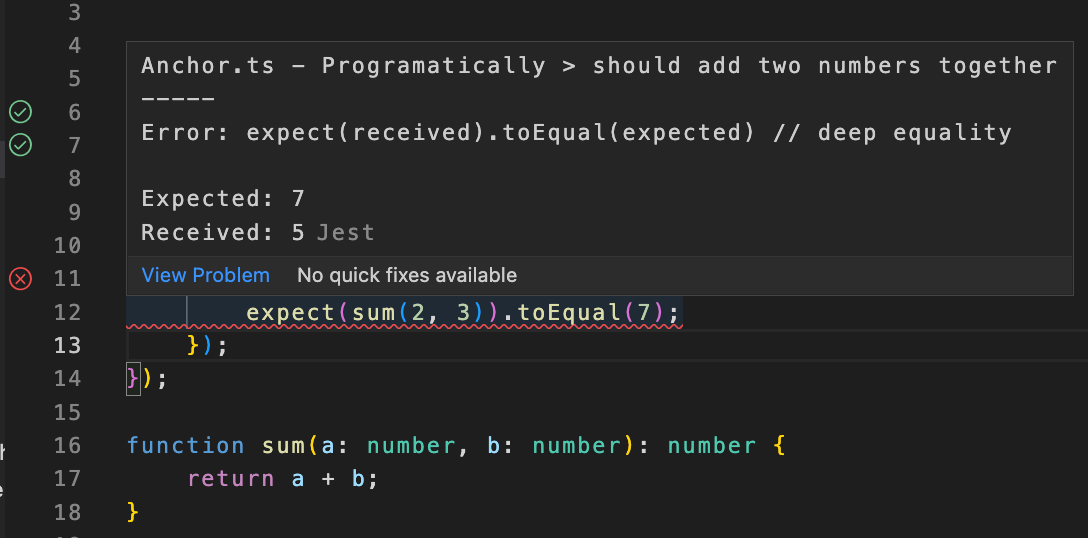
The Jest Extension adds an inline red underline where tests fail with a detailed error message. Additionally, you can see the status of all tests on the left side
The Jest Extension adds an inline red underline where tests fail with a detailed error message. Additionally, you can see the status of all tests on the left side
The Visual Studio Sidebar has a testing panel that will now display all of your jest tests and their status. This gives you a quick overview and an easy way to navigate between tests.
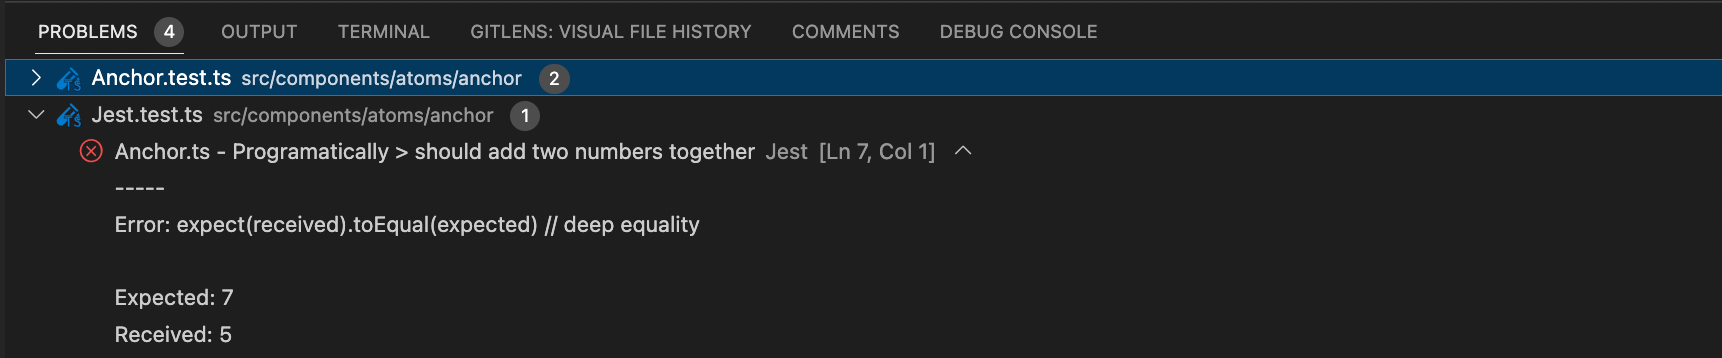
 Additionally, the failed tests are also displayed in the Problem inspector in the bottom panel.
Allows Debugging of Unit Tests
We can easily set up debugging for our Jest tests. First, create or open a .vscode/launch.json in the root of your project. The following configuration should be added to the file.
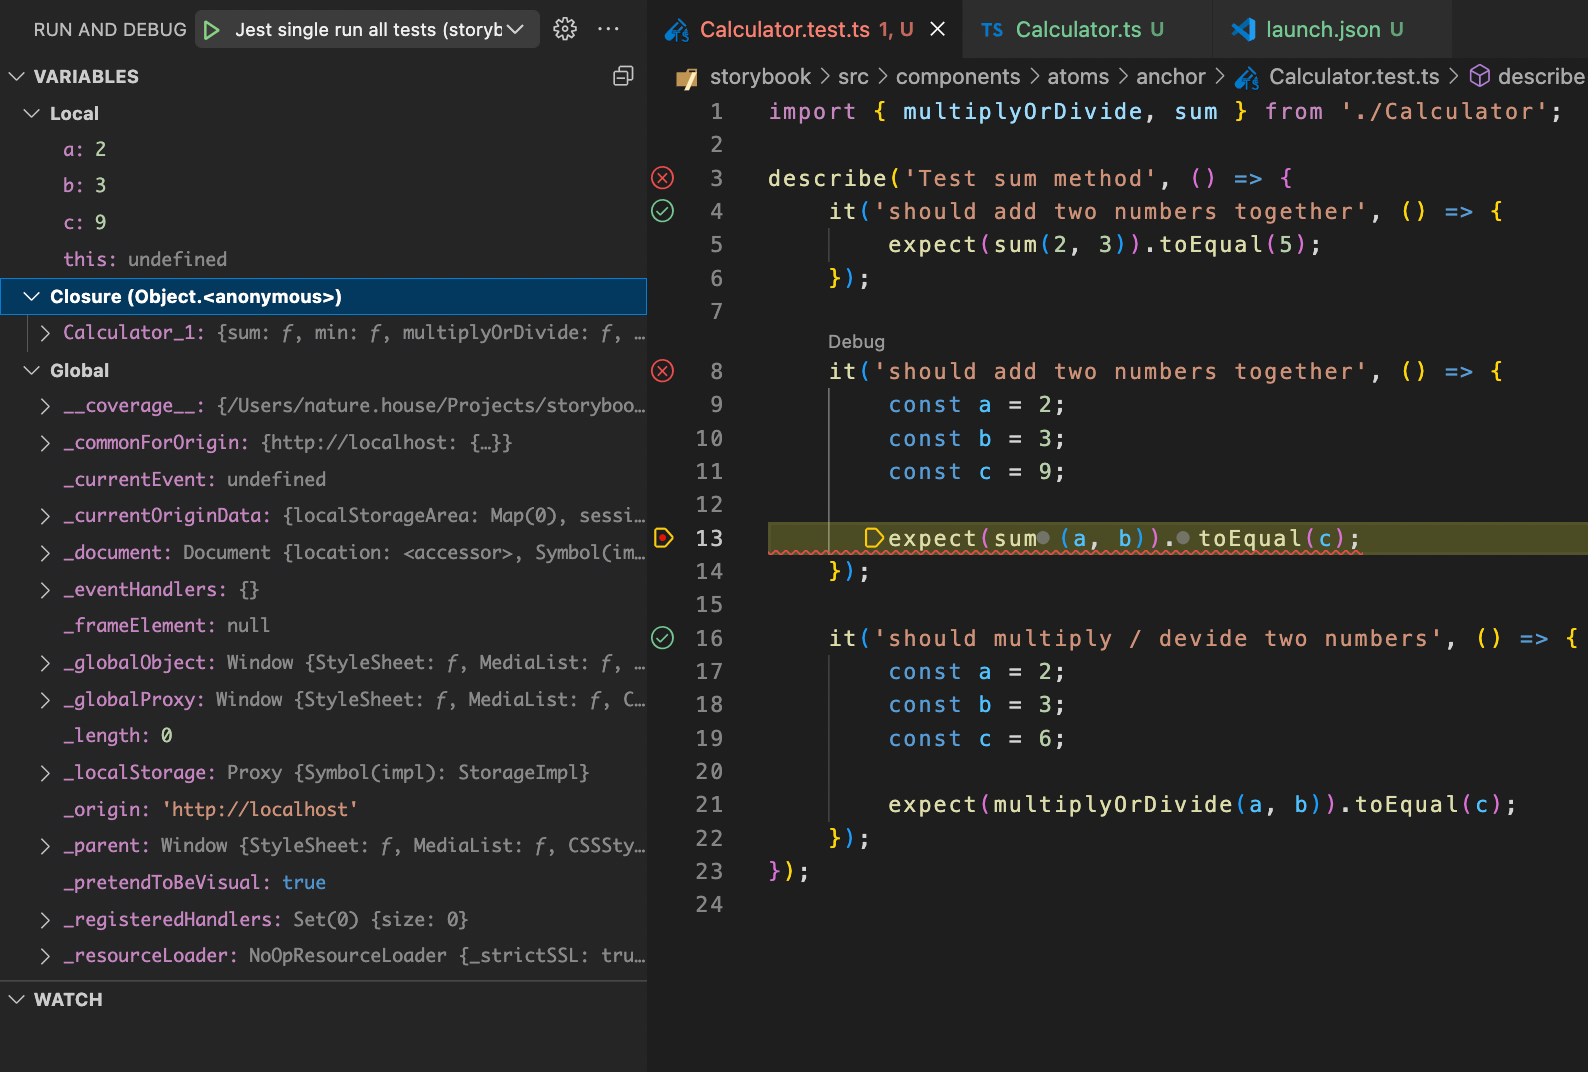
Navigate to a test file and set a breakpoint anywhere in the code where you would like to debug. You can set a breakpoint by clicking slightly left of the line number to set a round dot.
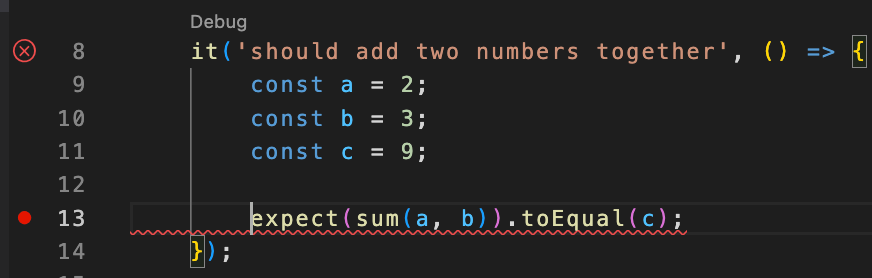
Example of a breakpoint on line 13 Example of a breakpoint on line 13 In the “Run and Debug” panel you can now press the play button to start debugging. This will display a lot of information:
- Local variables — All local variables will be displayed in the top left part of the panel alongside their values. You can use the debugger functions to move over your test lines and even into the method(s) you’re testing to find out why the test is not passing.
- Closure — All variables that are accessible in the enclosing scope.
- Global — All globally accessible variables.
Show Code Coverage In Files
The VSCode Jest extension offers an option to toggle Code Coverage reporting through the command palette. Open the command palette and look for the Jest: Toggle Coverage command.
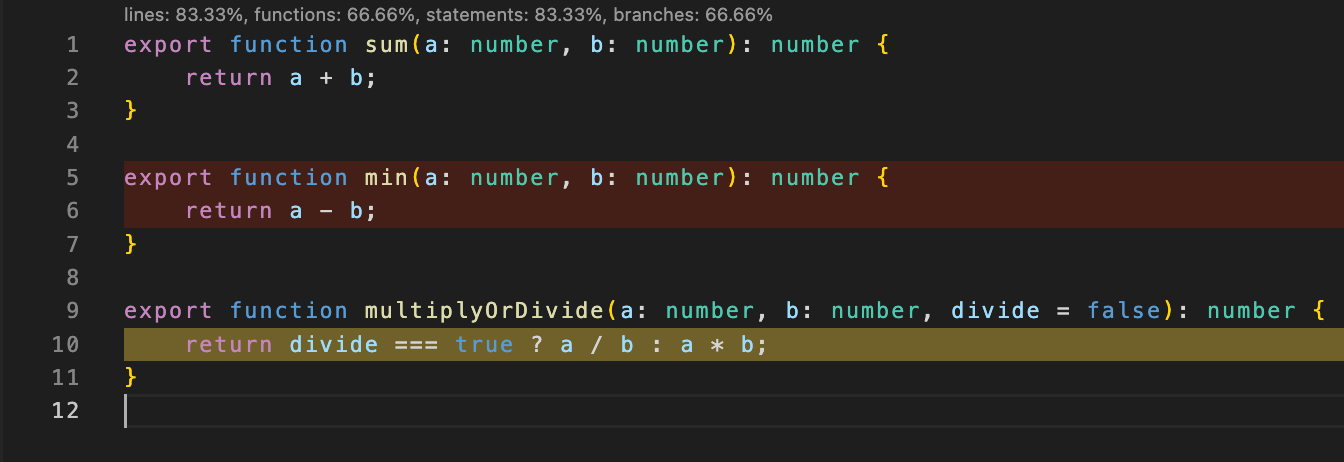
This will toggle several things in your code files as demonstrated in the screenshot below.
- At the top of the file, you get global information on the coverage of this file. It displays the percentage of functions, statements, and branches that are covered by unit tests.
- Untested lines are marked with a red background. This helps you figure out untested paths in your code at a glance.
- Partially tested code is marked with a yellow background. For example, the ternary operator below is only tested in one situation, but it never reaches the else clause.
Conclusion
If you’re like me and you have only ever used the CLI interface for your unit tests I would highly suggest you give editor tooling a try. I didn’t know how much I actually needed this until I experienced it myself. If you like my content and want to support my efforts, consider becoming a Medium subscriber through my affiliate link. It will cost you nothing extra, but Medium will give parts of the proceeds to me for referring you. And if you want, you can connect with me on LinkedIn or Twitter!
Comments
Loading comments…