Disclaimer: The material in this article is purely educational and should not be taken as professional investment advice. Invest at your own discretion. Some external links in this post are affiliated.
In this article, I will show you how you can calculate annualized returns using python! Be sure to check out the video for more details.
What Are Annualized Returns?
An annualized return is the average amount of money earned by an asset each year over some period of time (e.g. 10 years, 5years, 1 year, etc.). It is calculated by adding 1 to the cumulative return and raising the result to the power of 365 divided by the number of days held minus 1.
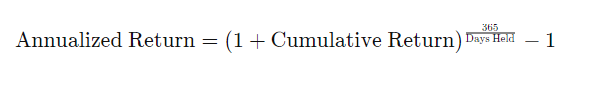
Formula For Annualized Returns
Why Use Annualized Returns?
According to Investopedia, the annualized return is used because the amount of investment lost or gained in a given year is interdependent with the amount from the other years under consideration because of compounding.
If you prefer not to read this article and would like a video representation of it, you can check out the YouTube Video. It goes through everything in this article with a little more detail and will help make it easy for you to start programming the code even if you don't have the programming language Python installed on your computer. Or you can use both the article and the video as supplementary materials for learning! The entire code and the logic behind the code are written or talked about in the video.
Programming
The first thing that I needed to do to start calculating annualized returns with Python was to import the libraries that I planned on using throughout the program.
#Import the libraries
import numpy as np
import pandas as pd
import matplotlib.pyplot as plt
Next, I loaded, read, and showed the stock data.
#Load the data
from google.colab import files
files.upload()
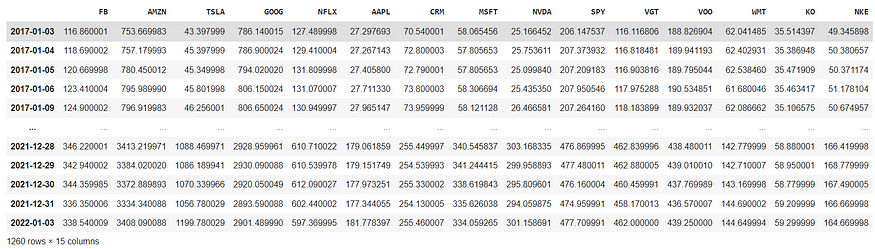
The stock data contained the price of the stock from different companies. All of which I planned to get the annualized prices.
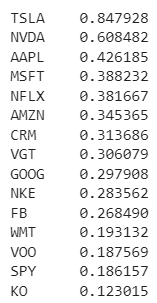
Next, I calculated the daily simple returns and multiplied them by 252 (roughly the number of trading days in a year) to get the annualized returns. Once I had the annualized returns, I sorted the data in descending order.
#Show the data
sorted_annualized_returns
Next, I wanted to see the data more visually, so I created a bar chart to display the information.
#Plot the sorted annualized returns
plt.bar(sorted_annualized_returns.index, sorted_annualized_returns)
plt.ylabel('Annualized Returns')
plt.xlabel('Assets')
plt.title('Annualized Returns of Assets')
plt.xticks(rotation = 90)
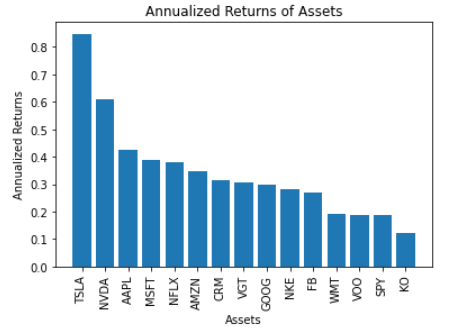
From the bar chart plot, I could easily see that Tesla (TSLA) gave more than an 80% annualized return which was also the highest return within this data set and Coca-Cola (KO) gave the least annualized returns at a little under 20%. Now, with this program, I have an easy way to calculate and see annualized returns for different assets and can compare them.
Thanks for reading this article I hope it was entertaining to you all! If you enjoyed this article and found it helpful please leave some claps to show your appreciation. If you aren't a member of Medium already, then consider becoming a member if not for my articles then for all of the other amazing articles & authors on this site. You can easily become a member of Medium by using the link here. Keep up the learning, and if you like finance, computer science, or programming please visit and subscribe to my YouTube channels (randerson112358 & computer science).
It's never too late to start investing. If you want to start an investment portfolio of your own, then sign up with WeBull using this link and get FREE stocks just for opening an account and funding it with an initial deposit of $100 or more! It's free stocks that you can either sell, play with or create your own trading strategy with. For a free stock trading app, I highly recommend it as you can trade all sorts of assets like cryptocurrencies and they have helpful charts and tools.
Comments
Loading comments…