
Network Graph. Source: https://chart-studio.plotly.com/~priyatharsan/182.embed
Network graphs (or diagrams) are useful for visualizing connections between entities. For example, subway maps are one of the most frequently encountered network graphs.
Nodes are the labels in the data to be visualized. The relationship between these nodes is expressed by the lines. Therefore, the data to be visualized must be in a format that includes node information and ‘from-to' data.
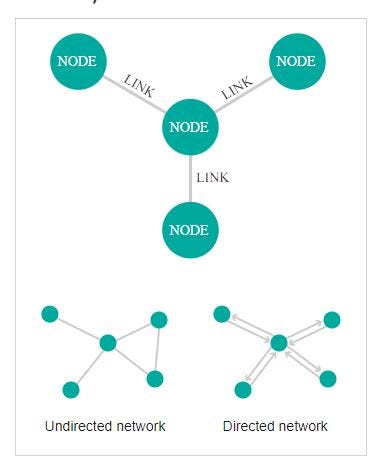
Anatomy. Source: https://datavizcatalogue.com/methods/network_diagram.html
Implementation
Let's generate dummy data to visualize.
import random
node_list = ["A","B","C","D","E","F","G","H","E"]
def draw_number(length):
    """determines a random index number for selection."""
    from_index = random.randint(0,length)
    to_index = random.randint(0,length)
    return from_index, to_index
from_list = []
to_list = []
counter = 20
i = 0
while i < counter:
from_index, to_index = draw_number(len(node_list)-1)
if from_index == to_index:
    continue
from_list.append(node_list[from_index])
to_list.append(node_list[to_index])
i += 1
I created 9 dummy nodes, gave each one a letter from the alphabet. The draw_number function determines a random index. According to these indexes, we select letters from the node list and add them to the from or to lists. We have 20 connections in total.
print(from_list)
print(to_list)
# ['B', 'E', 'B', 'B', 'B', 'C', 'C', 'E', 'D', 'A', 'E', 'E', 'H', 'B', 'B', 'C', 'A', 'A', 'G', 'G']
# ['F', 'D', 'D', 'D', 'D', 'F', 'H', 'C', 'F', 'E', 'B', 'B', 'B', 'E', 'H', 'E', 'B', 'E', 'E', 'A']
For visualization, we will use networkx and plotly libraries.
pip install networkx
pip install plotly
After importing libraries, the first thing I will do is to create an Graph object and append nodes and edges (connections) into that object.
import networkx as nx
import plotly.graph_objs as go
G = nx.Graph()
for i in range(len(node_list)):
G.add_node(node_list[i])
G.add_edges_from([(from_list[i], to_list[i])])
We need to decide on the layout of how the nodes will be lined up. You can find more information about these layouts here. I will use spring_layout in this example.
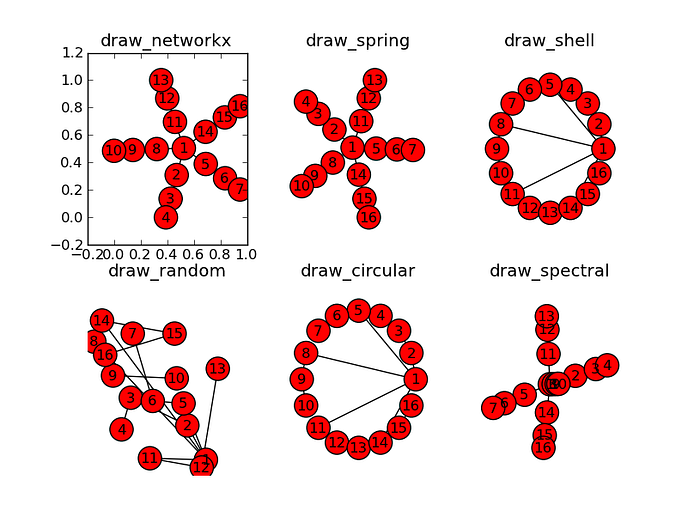
Some of the layout options. Source
pos = nx.spring_layout(G, k=0.5, iterations=100)
for n, p in pos.items():
    G.nodes[n]['pos'] = p
Let's transfer the nodes and edges we created in G to the plotly object. Edges:
edge_trace = go.Scatter(
    x=[],
    y=[],
    line=dict(width=0.5, color='#888'),
    hoverinfo='none',
    mode='lines')
for edge in G.edges():
    x0, y0 = G.nodes[edge[0]]['pos']
    x1, y1 = G.nodes[edge[1]]['pos']
    edge_trace['x'] += tuple([x0, x1, None])
    edge_trace['y'] += tuple([y0, y1, None])
Nodes:
node_trace = go.Scatter(
    x=[],
    y=[],
    text=[],
    mode='markers+text',
    hoverinfo='text',
    marker=dict(
        showscale=True,
        colorscale='pinkyl',
        reversescale=True,
        color=[],
        size=37,
        colorbar=dict(
            thickness=1,
            title='Node Connections',
            xanchor='left',
            titleside='right'
        ),
        line=dict(width=0)))
for node in G.nodes():
    x, y = G.nodes[node]['pos']
    node_trace['x'] += tuple([x])
    node_trace['y'] += tuple([y])

for node, adjacencies in enumerate(G.adjacency()):
    node_trace['marker']['color'] += tuple([len(adjacencies[1])])
    node_info = adjacencies[0]
    node_trace['text'] += tuple([node_info])
And the figure:
title = "Network Graph Demonstration"
fig = go.Figure(data=[edge_trace, node_trace],
            layout=go.Layout(
            title=title,
            titlefont=dict(size=16),
            showlegend=False,
            hovermode='closest',
            margin=dict(b=21, l=5, r=5, t=40),
            annotations=[dict(
                text="Text Here",
                showarrow=False,
                xref="paper", yref="paper")],
            xaxis=dict(showgrid=False, zeroline=False,
                       showticklabels=False, mirror=True),
            yaxis=dict(showgrid=False, zeroline=False,
showticklabels=False, mirror=True)))
fig.show()
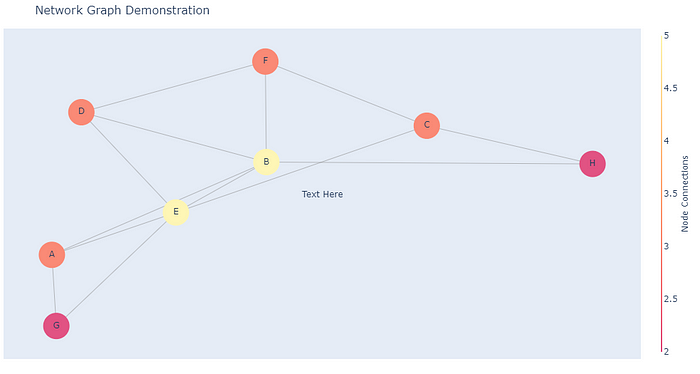
Network Graph. Image by the author.
You can play around with the parameters to customize the look.
Thanks for reading. If you have any questions or comments, please feel free to write me!
Comments
Loading comments…