Let's take a binary example (class 0 and class 1). K is the number of neighborhood points we would take to decide in which class our test data belongs. K should not be taken in even number it should be odd i.e., 1,3,5,7,9.
But the question is how we take best value of K for prediction of test data belongings. Let's get started.
To find the best value of k we take some range of values of k and then we will calculate the mean error rate of all these Ks. Let's understand it using Python.
1. Before applying best fit k value
Let's understand what is the accuracy score and confusion matrix for randomly taken k value.
clf=KNeighborsClassifier(n_neighbors=1)
clf.fit(x_train,y_train)
pred=clf.predict(x_test)
con=confusion_matrix(y_test,pred)
ax=sns.heatmap(con,annot=True,cmap="viridis",annot_kws={"size":20})
bottom, top = ax.get_ylim()
ax.set_ylim(bottom + 0.5, top - 0.5)
plt.show()
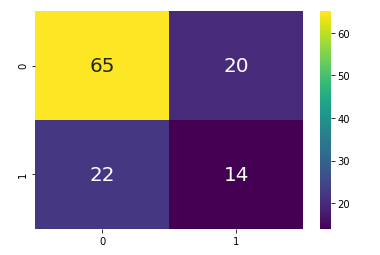
confusion matrix at k=1
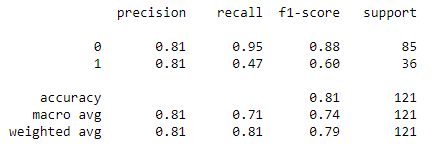
# printing precision,recall,accuracy score etc
print(classification_report(y_test,pred))
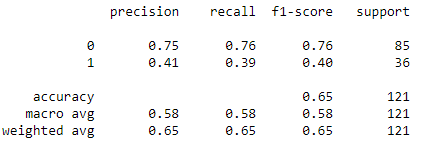
Evaluation Parameter
2. Finding best fit k value
error_rate=[]#list that will store the average error rate value of k
for i in range (1,31):  #Took the range of k from 1 to 30
    clf=KNeighborsClassifier(n_neighbors=i)
    clf.fit(x_train,y_train)
    predict_i=clf.predict(x_test)
    error_rate.append(np.mean(pred_i!=y_test))
erro_rate
Output will be the list of average value of error rate for each iteration of k.
#plotting the error rate vs k graph
plt.figure(figsize=(12,6))
plt.plot(range(1,31),error_rate,marker="o",markerfacecolor="green",
     linestyle="dashed",color="red",markersize=15)
plt.title("Error rate vs k value",fontsize=20)
plt.xlabel("k- values",fontsize=20)
plt.ylabel("error rate",fontsize=20)
plt.xticks(range(1,31))
plt.show()
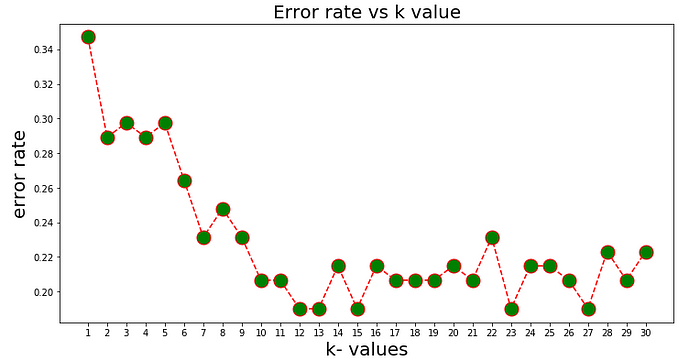
Range of k values
As we see in above figure after k=23 the fluctuation in error rate is not much . Hence whenever we will see the threshold value after which k-value is not fluctuating more we will select that specific threshold value as k value.
I have chosen k=23 for modeling our dataset.
3. After applying best fit k value
clf=KNeighborsClassifier(n_neighbors=23)
clf.fit(x_train,y_train)
predicted_value=clf.predict(x_test)
con_mat=confusion_matrix(y_test,predicted_value)
sns.heatmap(con_mat,annot=True,annot_kws=
                       {"size":20},cmap="viridis")
plt.show()
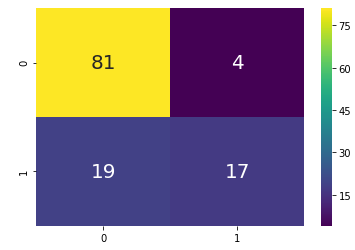
confusion matrix at best k value
print(classification_report(y_test,predicted_test)
Score at optimal k value
By comparing both the scenario we can observe that at optimal k value we are able improve the model accuracy.
Comments
Loading comments…