
In this article, I will be showing you how you can calculate the Exponential Moving Average of a stock using Python.
Step 1. Install the modules
The modules that we will be needing are listed below and you can simply install them with
a pip3 install.
pip3 install numpy==1.20.0\
pip3 install pandas==1.1.4\
pip3 install pandas-datareader==0.9.0\
pip3 install matplotlib==3.3.3
Step 2. Understanding Exponential Moving Average
Although I won't be going too deep into the concept of EMA (Exponential Moving Average), I will be giving you a brief overview of what it is. EMA is a type of moving average indicator that gives greater weight or importance to previous stock prices. The essential difference between EMA and SMA is that EMA responds faster to upward price movement compared to SMA. The formula for calculating EMA is as follows.
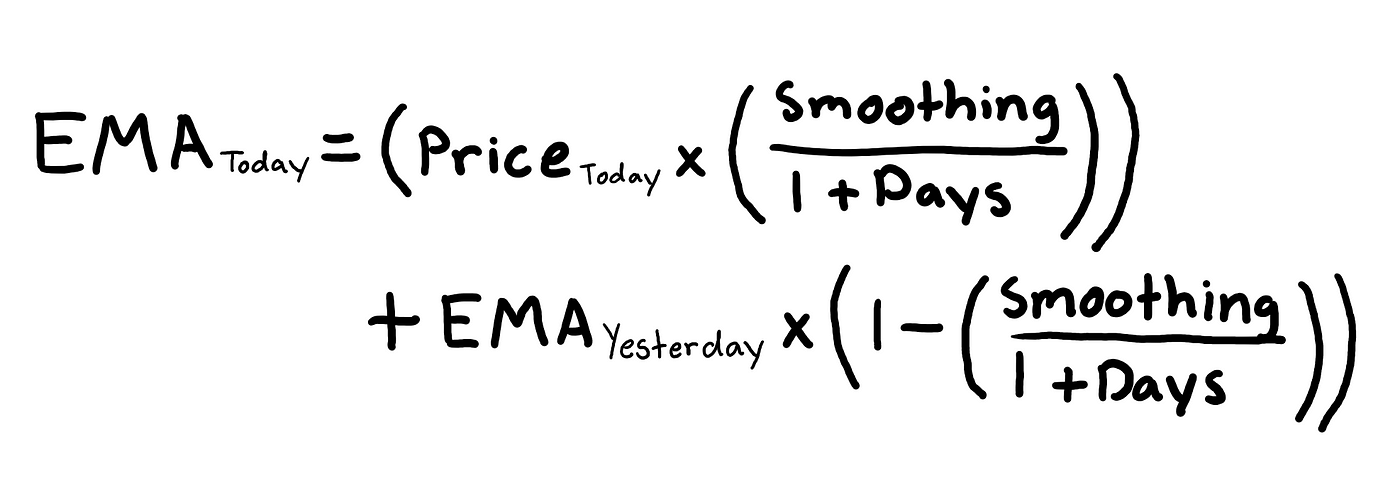
The smoothing factor can be altered upon preference, but a common choice for this variable is 2 and that is what we will be using. Traders use various day lengths when calculating EMA, but a common one is a 10-day period and that is what we will be using.
Step 3. How to calculate EMA
In Step 2, we established that we would be calculating EMA for every 10 day observations. The first step to calculating EMA is to actually calculate the SMA of the day length constant. In our case, we will first calculate the SMA of the first 10 stock prices. We will then consider the 10 day SMA to be our first EMA value. Now we will calculate the EMA for the 11th day price using the formula I mentioned earlier. You can repeat the process of using the EMA formula repeatedly until you have finished calculating for all the stock prices.
Step 3.1. Example
In this example, we will be calculating the 5-day EMA of the following set of numbers with a smoothing value of 2.
10, 11, 11.5, 10.75, 12, 11.75, 12.25, 14, 16, 17, 15.6, 15.75, 16, 14, 16.5, 17, 17.25, 18, 18.75,
20
The first thing we will do is find the SMA of the first 5 numbers.
EMA = []\
(10 + 11 + 11.5 + 10.75 + 12) / 5 = 11.05
Let's add 11.05 to our EMA list.
EMA = [11.05]
Now we will use the EMA formula to calculate the EMA for the 6th number.
(11.75 x (2 / (1 + 5))) + 11.05 x (1 - (2 / (1 + 5))) = 11.28\
Add 11.28 to our list of EMA: [11.05, 11.28]
Continue the process of using the EMA formula for all the numbers in the set and that is how you calculate the EMA of a stock.
11.05, 11.28, 11.61, 12.40, 13.60, 14.73, 15.02, 15.26, 15.51, 15.01, 15.50, 16.00, 16.42, 16.95,
17.55, 18.36
Step 4. Coding Setup
Now its time to start coding. We can start by setting up the basic things we will need.
- Import all the necessary modules
- Create an empty function
calculate_ema(prices, days, smoothing=2) - Get the stock price data for a certain stock - (MSFT, 2015--01--01, 2016--01--01)
import numpy as np
import pandas as pd
import matplotlib.pyplot as plt
import pandas_datareader as web

def calculate_ema(prices, days, smoothing=2):
  pass

symbol = 'MSFT'
df = web.DataReader(symbol, 'yahoo', '2015-01-01', '2016-01-01')
Step 5. Calculating EMA
Remember that the first step to calculating the EMA of a set of number is to find the SMA of the first numbers in the day length constant. There are two simple ways we can go about this.
def calculate_ema(prices, days, smoothing=2):
    ema = [sum(prices[:days]) / days] # First method
    ################################################
    ema = []
    ema.append(sum(prices[:days]) / days) # Second method
Now we need to loop through the numbers that are not in the range of the day length constant and repeatedly calculate the EMA for them and add them to our EMA list.
def calculate_ema(prices, days, smoothing=2):
    ema = [sum(prices[:days]) / days]
    for price in prices[days:]:
        ema.append((price * (smoothing / (1 + days))) + ema[-1] * (1 - (smoothing / (1 + days))))
    return ema
By the end of this step, your code should look something like this.
import numpy as np
import pandas as pd
import matplotlib.pyplot as plt
import pandas_datareader as web

def calculate_ema(prices, days, smoothing=2):
    ema = [sum(prices[:days]) / days]
    for price in prices[days:]:
        ema.append((price * (smoothing / (1 + days))) + ema[-1] * (1 - (smoothing / (1 + days))))
    return ema

symbol = 'MSFT'
df = web.DataReader(symbol, 'yahoo', '2015-01-01', '2016-01-01')

ema = calculate_ema(df['Close'], 10) # Add this line to save EMA values in a list
Step 6. Plotting the results
We can plot the actual stock prices and the calculated EMA with matplotlib.
import numpy as np
import pandas as pd
import matplotlib.pyplot as plt
import pandas_datareader as web

def calculate_ema(prices, days, smoothing=2):
    ema = [sum(prices[:days]) / days]
    for price in prices[days:]:
        ema.append((price * (smoothing / (1 + days))) + ema[-1] * (1 - (smoothing / (1 + days))))
    return ema

symbol = 'MSFT'
df = web.DataReader(symbol, 'yahoo', '2015-01-01', '2016-01-01')

ema = calculate_ema(df['Close'], 10)

price_X = np.arange(df.shape[0]) # Creates array [0, 1, 2, 3, ..., df.shape[0]]
ema_X = np.arange(10, df.shape[0]+1) # Creates array [10, 11, 12, 13, ..., df.shape[0]+1]
                                     # We start at 10, because we use the first 10 values to calculate the SMA,
                                     # then we calculate EMA form the 11th value

plt.xlabel('Days')
plt.ylabel('Price')
plt.plot(price_X, df['Close'], label='Closing Prices')
plt.plot(ema_X, ema, label='EMA')
plt.legend()
plt.show()
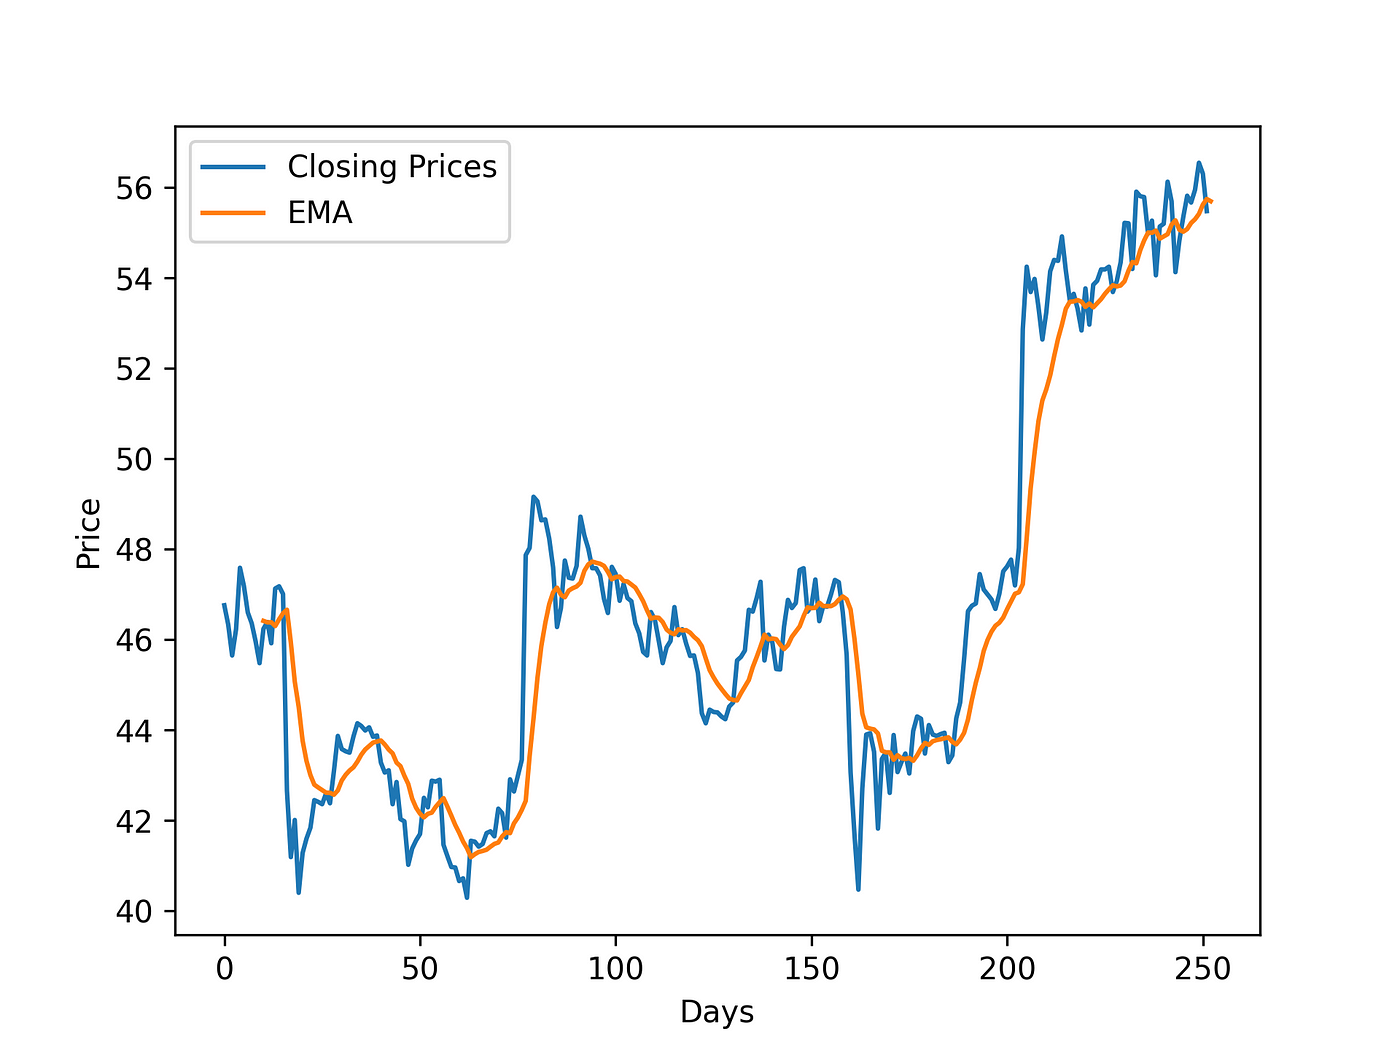
Your plot should look something like this.
Conclusion. How to use EMA for stocks?
While there are many ways to use the Exponential Moving Average of a stock for technical analysis, a basic usage of it is recognizing a buy signal when the EMA line goes underneath and stock line and is heading in an upward direction. A sell signal can be recognized when the EMA line goes over the stock line and it is heading in a downward direction. To conclude, I hope you learned something new and useful from this article which you can use later in your Python projects.
Comments
Loading comments…