Most modern devices maintain a log of activity. This can mean storing information like devices communicated with, files downloaded/uploaded and type of communication protocol.
This useful information plays a vital role in identifying where a threat originated from and potential damage from it.
For example; if you are a victim of a computer virus, exploring your computer’s activity can help you pinpoint the action that led to a malicious program/file being downloaded. Next, you can track that program to see if it traveled to another computer in your network!
In this article, I am going to show you how you can use Python to analyze network traffic activity. Specifically, I am going to use a file from a WireShark lab (not a real network but mimics the activity of one). WireShark offers a range of tools that can help you analyze the logs, but learning how to digest the data with Python can help speed up the process.
Let's Get Started
We are going to use a few Python libraries:
- Pandas as pd → read data and store in a dataframe
- MatPlotlib as plt → graph data
- Networkx as nx → graph data as nodes if they communicated
Next, load your data based on its file path. Looking at our data frame, we see the columns →‘No.’, ‘Time’, ‘Source’, ‘Destination’, ‘Protocol’, ‘Length’, ‘Info’
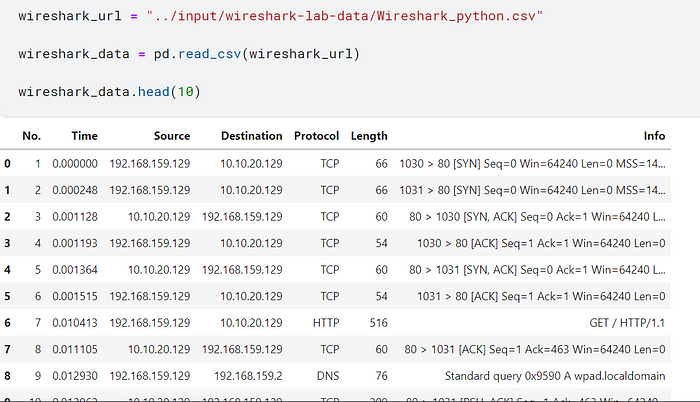
Looking at our data row by row doesn’t reveal much information.
Now that our data is in a neat data frame, we can use the functions:
- groupby() → select column to identify and group by unique values
- count() → count how many times a value appears in the data frame as a value
- sort_values → display values based on size
We are going to use these functions to understand devices that initiated conversations, accepted communications, and types of communications.
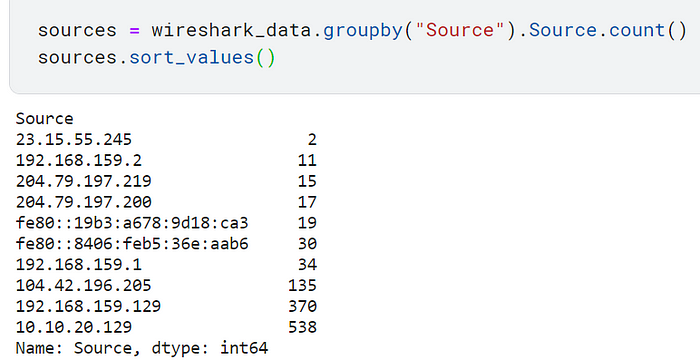
Taking a look at “sources” reveals which devices had the least/most number of communications.
You can note the same information from “destinations”.
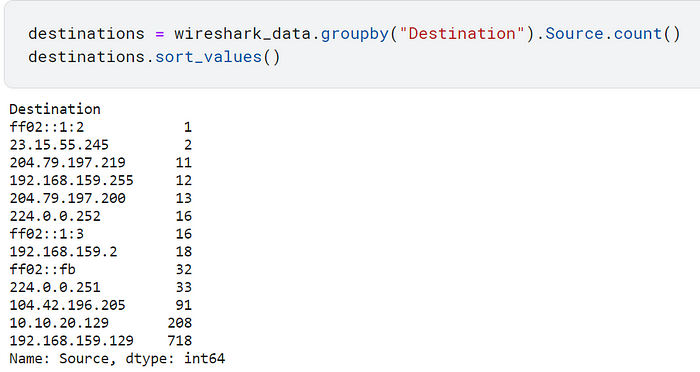
This type of information is worth noting if you are analyzing network traffic because some IPs might be from unknown devices (which can mean they are malicious) or are showing an abnormal amount of activity.
If you investigate “protocols”, you’ll see a few HTTP types of communications. As a security professional, you know that means information communicated is not encrypted. Meaning, anyone can read it, so hopefully, there was nothing confidential!
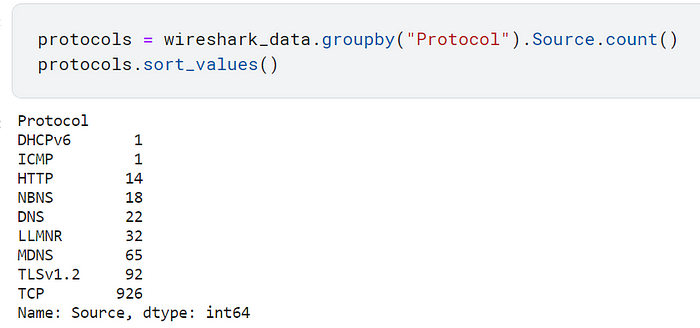
You can also use this to see if a type of communication has an abnormal amount of frequency based on your known and normal activity
Apply Graph Theory
Using networkx in Python, you can build node graphs that represent a type of communication.
Since our data is in a pandas data frame, we can use networkx directly on it and select our nodes as “source” and “target”. The nodes we are interested in are “Source” and “Destination”. Choosing these nodes will help us see how devices on this network communicate.
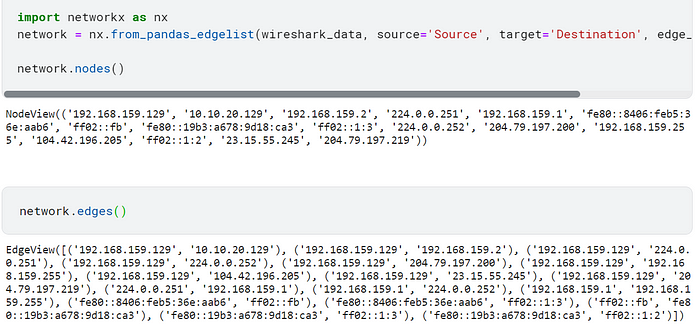
The little bit of code that was cut on the first cell is “edge_attr=True”).
With our chosen nodes, we’ll use networkx again with the function draw_circular to display a network map based on the traffic!
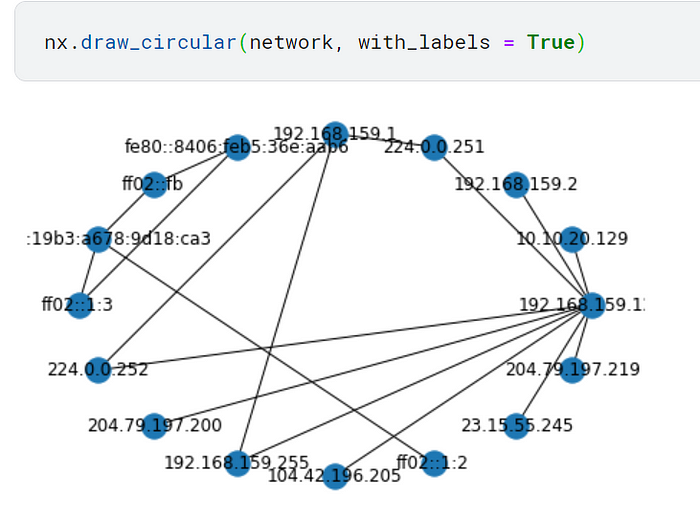
We can see who communicates with who!
Now, let’s say you red flag a device. You don’t recognize its owner so its activity should not appear in your private network traffic.
We’ll call that device suspect and use networkx to create a color-coded map showing us which devices the malicious device communicated with.
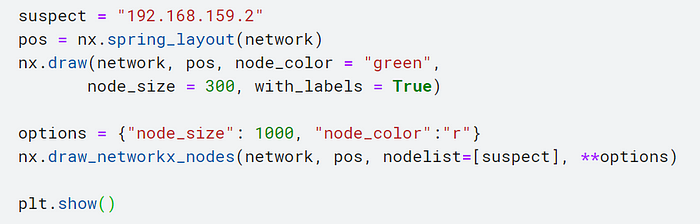
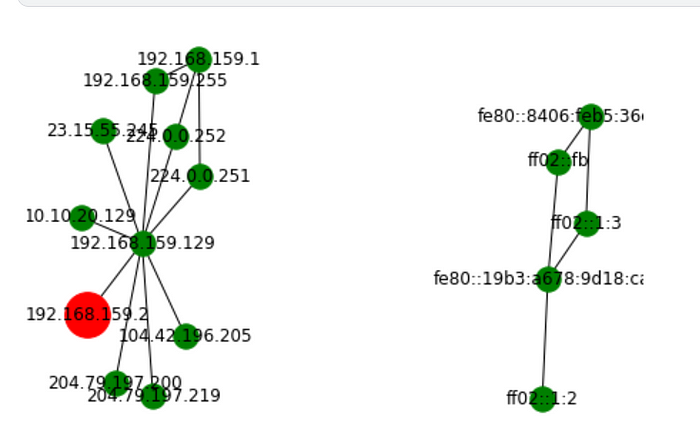
Voila!
Observing our results we see which devices it communicated with and other devices it could have potentially reached.
Taking a deeper look at the malicious device, we can make a new data frame that includes other devices it communicated with, type of communication, the time it happened, and information about it.
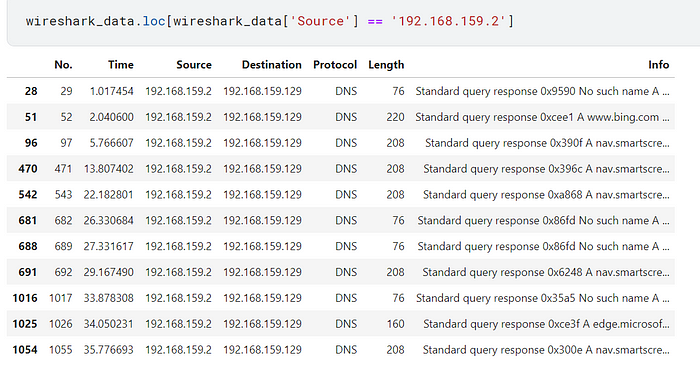
You can do this for column “Protocol” to make different data frames based on the type of communication
Resources and further information
Highly recommend checking out this article!
The Graph Theory — An Introduction In Python
For further documentation that will help you on further projects:
Comments
Loading comments…