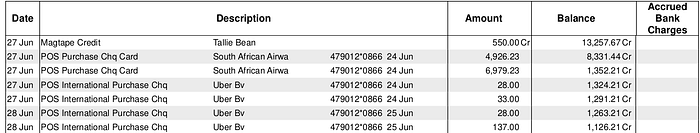
The image above shows a snapshot of my student life, the flying home during breaks and Uber trips about four years back. We see that the PDF contains a date, a relatively long transaction description, the amount, the running balance, and accrued bank charges. These variables serve as a sound basis for answering exciting questions regarding one's spending behaviour. But before answering any questions using this data, we need to "liberate" it from the PDF.
Installation & imports
For this example, let's parse the data tables from the PDF bank statement into a pandas data frame, using a Python package called tabula. Let's take a look at the code!. To install tabula, run:
!pip install -q tabula-py
First, we import a couple of packages and define the path to the PDF bank statement.
Clean transaction description
Second, as seen from the PDF snapshot, the transaction description column is quite busy. It includes the type of transaction, whether Point of Sale (POS) purchase, Cash Withdrawal etc., along with the merchant name, Tallie bean, South African Airways, and Uber in this case and a combination of what I suspect to be the masked card number and date. To clean this column up, we do a couple of things using regular expressions, including removing punctuations, numbers and certain unnecessary words.
Putting Everything Together
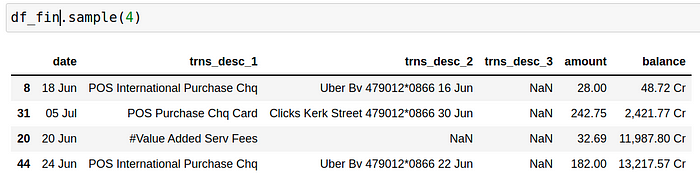
The bulk of the remaining code is a single function called main_func, which accepts the file path and then does several things. This section will provide a breakdown of the individual pieces of code, along with the motivations. You might find that your bank statement has a completely different structure, and thus you might need totweak the input parameters depending on the format. The code above reads in the content of each PDF page into a list (df_list), using tabula.read_pdf(). Given that the initial output is imperfect, i.e., contains columns with missing values, we clean up each list element by dropping unnecessary columns, appending them to a new data frame and renaming column names to get the view below:
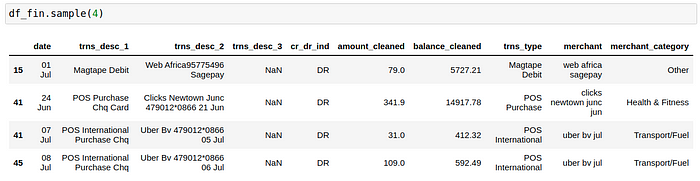
 Almost there! Now to answer reasonable questions with this data, we have to do a few more things. Firstly, we want to distinguish between debits and credits, i.e. money leaving and coming into the account. Secondly, convert the amount and balance columns to numeric to allow us to perform aggregations later on. Thirdly, create a transaction type (trns_type) column by extracting the first two words from the trns_desc_1 column.Finally, although not ideal, manually classify the various transactions into arbitrarily chosen spending categories, including Groceries, Transport/Fuel, Construction, Airtime, Savings & Investments, Fast Food, Health & Fitness, and Restaurant/Bars. The spend classification is the most tedious part of the code, and thus spend category via machine learning algorithms might be more promising.
 There you have it! We have gone from a PDF with tables to a well-formatted data frame. Pretty cool!. Have a look at the complete code here.
We will visualize this data in the following article and present the final format in a dashboard view using Python, Panel and Plotly. Here's a preview:
There you have it! We have gone from a PDF with tables to a well-formatted data frame. Pretty cool!. Have a look at the complete code here.
We will visualize this data in the following article and present the final format in a dashboard view using Python, Panel and Plotly. Here's a preview:
Screenshot of the Panel Application.
That's all for this article, thank you for reading, and I hope you found this article interesting! Stay tuned for the next one. Let me know if you have a better alternative to the manual spend classification in the comments 🙂.
Comments
Loading comments…