
Recently, pandas have come up with an amazing open-source library called pandas-profiling. Generally, EDA starts by df.describe(), df.info() and etc which to be done separately. Pandas_profiling extends the general data frame report using a single line of code: df.profile_report() which interactively describes the statistics, you can read it more here.
However, pandas_profiling cannot be straightforwardly used on Colab. The code will result in an error, as below;
“concat() got an unexpected keyword argument ‘join axes“
This is because Google Colab comes with a pre-installed older version of Pandas-profiling (v1) and the join_axes function is deprecated in the installed Pandas version on Google Colab.
The two main commands for Google Colab are:
! pip install [https://github.com/pandas-profiling/pandas-profiling/archive/master.zip](https://github.com/pandas-profiling/pandas-profiling/archive/master.zip)


profile.to_notebook_iframe()
STEPS: Install Pandas Profiling on Google Colab.
1. Run the below command, you can visit the link on github.
! pip install [https://github.com/pandas-profiling/pandas-profiling/archive/master.zip](https://github.com/pandas-profiling/pandas-profiling/archive/master.zip)
2. Restart the kernel
3. Re-import the libraries
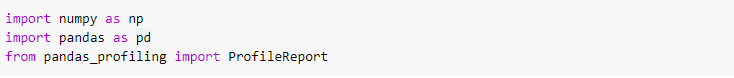
4. Import and read your data set
5. Define your profile report:
profile = ProfileReport(df, title=’Heart Disease’, html={‘style’:{‘full_width’:True}})
OR as snapshot below

6. However, profile.to_widgets() will not be working properly as it is not yet fully supported on Google Colab, as below snapshot :
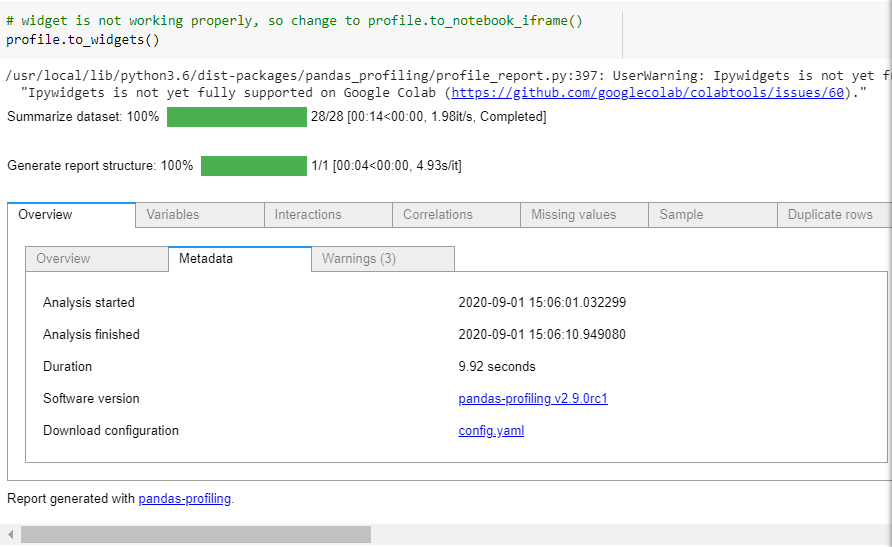
7. Instead, change to profile.to_notebook_iframe(), as below snapshot:

and here’s your output:
 Gif by Author
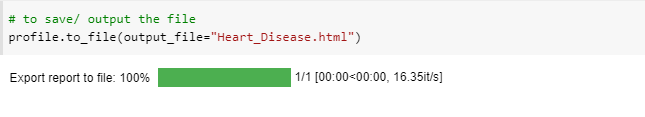
8. Save your output file in html format: so you can share as a webpage
Pandas_profiling displays descriptive overview of the data sets, by showing the number of variables, observations, total missing cells, duplicate rows, memory used and the variable types. Then, it generates detailed analysis for each variable, class distributions, interactions, correlations, missing values, samples and duplicated rows, which you can observe by clicking each tab.
I hope this will help you to play around with Pandas profiling.
UPDATE !!
there will be an error when you try re-run your notebook, as below;
TypeError: load() missing 1 required positional argument: 'Loader'
This is because the new version of pyyaml 6.0 is not compatible with the current way Google Colab imports packages. Hence, you’ll need to change pyyaml version back to the previous version by running code below.
!pip install pyyaml==5.4.1
So grateful for stack overflow, you can find the explanation here.
I hope this will help you to play around with Pandas profiling. Happy exploring!
Comments
Loading comments…