We are going to cover:
-
Why structured logs are important
-
How does JSON fit in
-
Web server logging example with GoLang
-
CloudWatch Log Insights walkthrough
Why are structured logs important?
It is about saving time in the future and improving analytics.
I have started outputting logs in JSON format because I don't have time for anything else. I found that producing structured logs can save countless hours or days later on and takes little to no upfront effort. So I have decided to write logs for the computers, not the humans.
Anyone who works with software or infrastructure at some point has gotten a request to comb through piles of logs looking for the proverbial needle in a haystack, trying to track down a customer issue or determine the root cause of an outage. In the past, this process usually started with a few standard commands (grep, gawk, etc) combined with pipes and then maybe into a quick Bash script and hopefully never goes beyond a small Python app. All because hidden away in these log files could be the key, the missing link to our problem.
How long did the above analysis take? Hours? Days? How confident are you in your regex and text parsing skills?
But it does not stop there because not everyone is a command-line ninja that has mastered the tools above. Other teams will want reports and access to the logs for their own purposes:
-
Support teams need access to logs to find the cause of customer issues
-
DevOps teams need access to logs to troubleshoot production environments or help in determining the health of a service
-
Managers or business analysis require logs to determine feature usage and customer behaviour
You want to empower your team, your manager and the support teams with the information they need to make decisions. Not coming to you asking for reports, stats or regex help.
Make your work life easier, don't send in streams of unstructured text and then try to piece together analytics later on. Someone will end up spending hours trying to determine meaningful information or writing code to parse and analyze the data. Let the tools already in place do the work for you.
This is where JSON logs come into play
On Jan 20, 2015, AWS announced support for JSON-formatted logs with CloudWatch Logs:
“We are happy to announce support for monitoring JSON-formatted logs with CloudWatch Logs. This capability enables you to create graphs and receive notifications when your JSON-formatted log events contain terms or match conditions that you choose. For example, you can use CloudWatch to notify you when specific fields occur in your JSON log events or to create time-series graphs of values from your JSON log events.”
In Nov 2018 AWS announced CloudWatch Log Insights (Insights) which adds:
-
Fast execution
-
Insightful visualization
-
Powerful syntax
“With a few clicks in the AWS Management Console, you can start using CloudWatch Logs Insights to query logs sent to CloudWatch. You can instantly begin writing queries with aggregations, filters, and regular expressions. In addition, you can visualize time series data, drill down into individual log events, and export query results to CloudWatch Dashboards.”
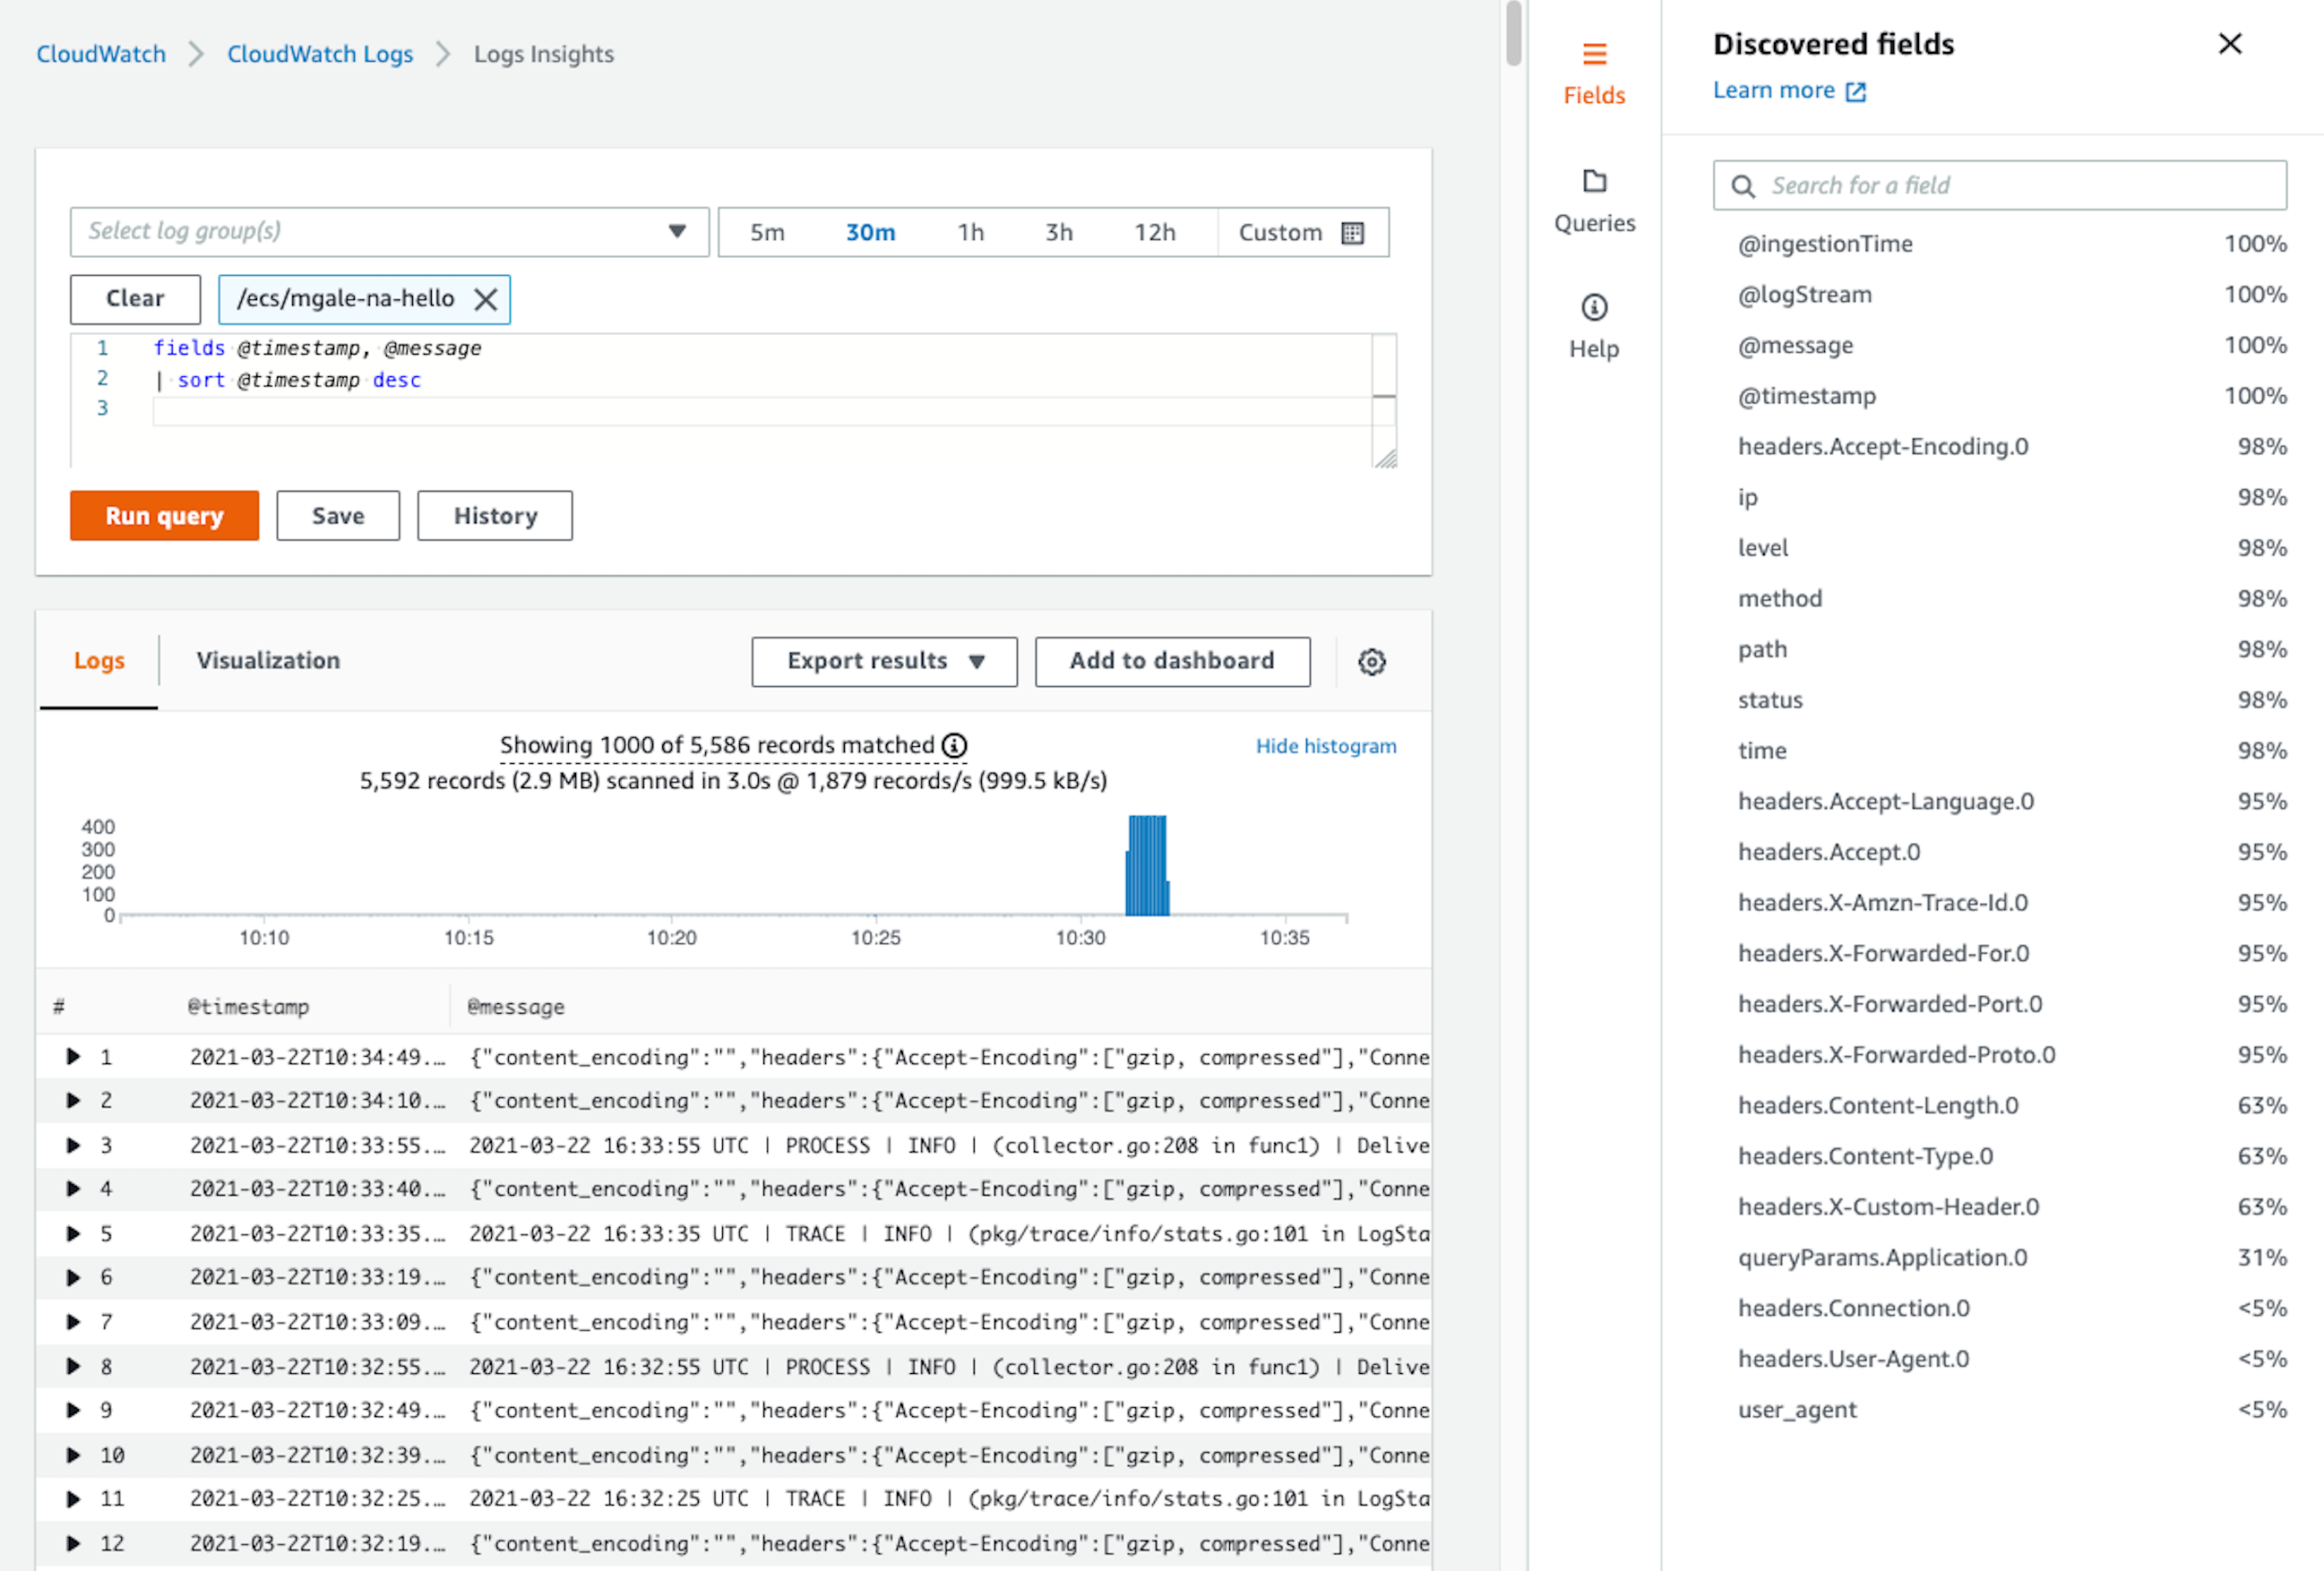
By sending in JSON-formatted logs we are making AWS do all the heavy lifting. Insights will automatically parse the content and create fields based on the JSON message. Insights can extract a maximum of 1000 log event fields from a JSON log.
It will also allow access to nested JSON fields using the dot notation and flatten arrays into a list of field names and values.
Below you can see 20 fields have automatically been extracted by CloudWatch allowing us to search, filter and produce metrics based on that data.
Before we dive further into Insights query examples let's look at the code used to generate the log entries to help provide some context.
Web server logging example with GoLang
To show off Insights JSON parsing features and rich query abilities I created a small Golang web app and bundled it as a container to run in AWS Fargate.
The code is available here.
This demo web app will log all incoming HTTP requests including the HTTP Headers and URL query parameters.
If the URL path contains the word “bad” then an HTTP 404 will be returned instead of the standard HTTP 200 response code. A successful response will include information about the incoming request for demo purposes.
The logging functionality has been added to the HTTP router via a middleware handler: https://github.com/mgale/examples/blob/main/cloudwatchlogs/main.go#L91
Logrus was used to provide the JSON logging output: https://github.com/sirupsen/logrus
Here is a sample log entry for a single HTTP request:
{"content_encoding":"","headers":{"Accept":["*/*"],"Customeheader":["App1"],"User-Agent":["curl/7.68.0"]},"ip":"127.0.0.1","level":"info","method":"GET","msg":"","path":"/fake/url/path","queryParams":{"param":["one"]},"status":200,"time":"2021-03-28T15:12:57-06:00","user_agent":"curl/7.68.0"}
Switching from text-based logs to JSON logs is a simple SetFormatter change:
log.SetFormatter(&log.JSONFormatter{})
log.Infof("Server is ready to handle requests at: %v", httpListenAddress)
That transforms this:
INFO[0000] Server is ready to handle requests at: :8080
into this:
{"level":"info","msg":"Server is ready to handle requests at: :8080","time":"2021-03-28T14:20:36-06:00"}
CloudWatch Log Insights walkthrough
Here is a normal view inside Insights with text-based logs, as you can see only the standard 4 fields are available under “Discovered fields”
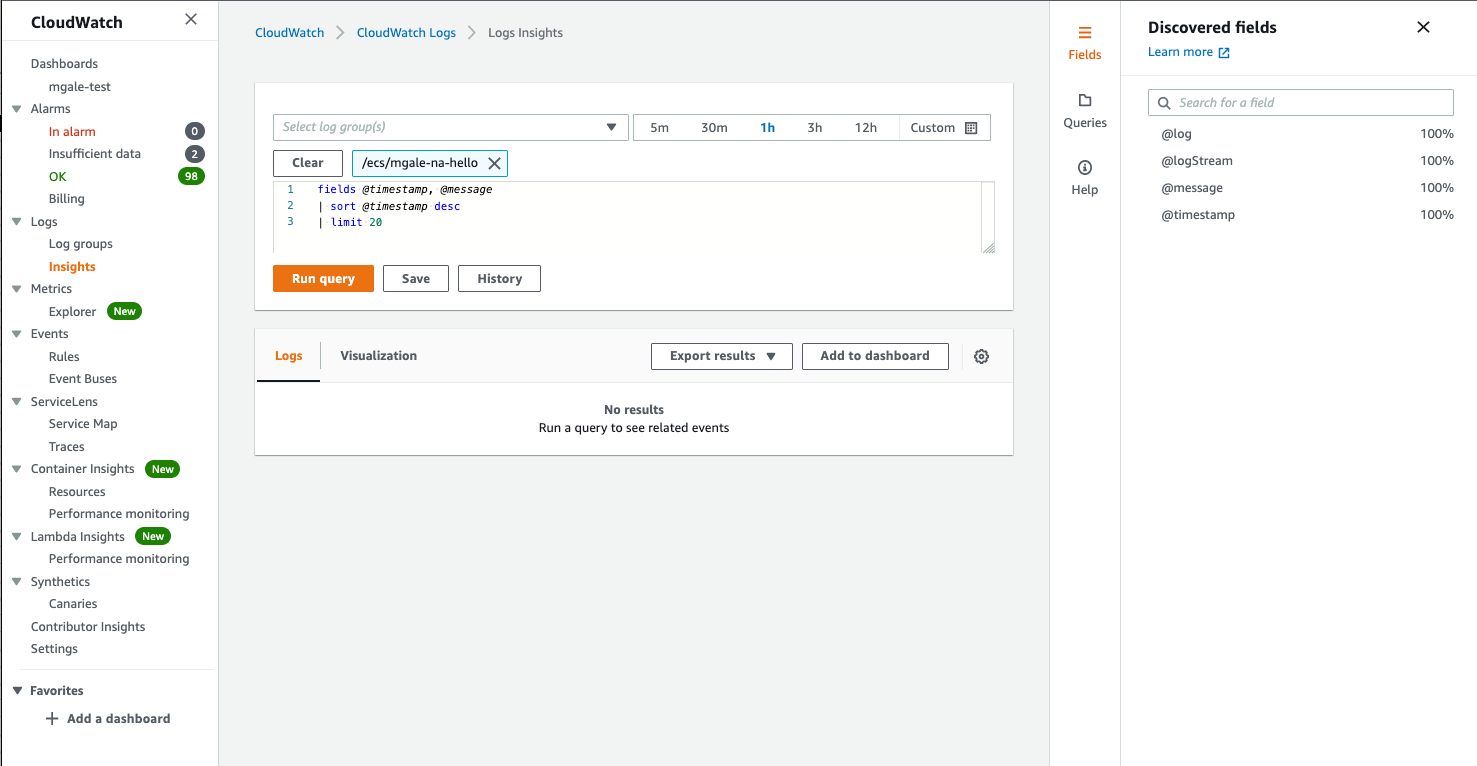
When using text-based logs normally written for people to read we will need to start with parsing and filtering commands to try and pull out key pieces of information before we can report on the metrics.
I borrowed a few examples from https://marbot.io/blog/analyze-cloudwatch-logs-like-a-pro.html on what parsing text-based logs can look like:
fields @timestamp, @message
| filter @message like /^.*Status\:\s(\d*),\sIntegration\slatency\:\s(\d*)\sms$/
| sort @timestamp desc
and
fields @timestamp, @message, @latency, @status
| filter @message like 'Received response.'
| parse @message /^.*Status\:\s(?<@status>\d*),\sIntegration\slatency\:\s(?<@latency>\d*)\sms$/
| filter @latency > 100 and @status = 200
| sort @latency desc
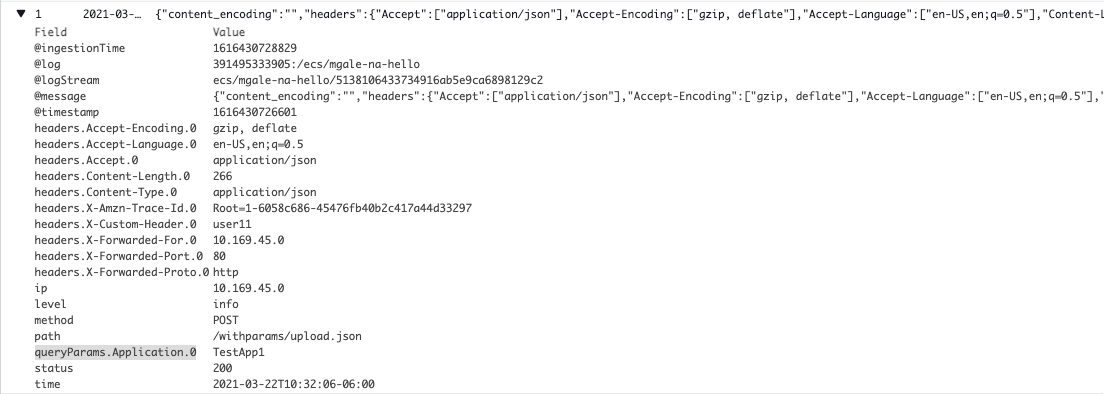
Here is an Insights view when JSON logs are sent in, 20 additional fields are available for use:
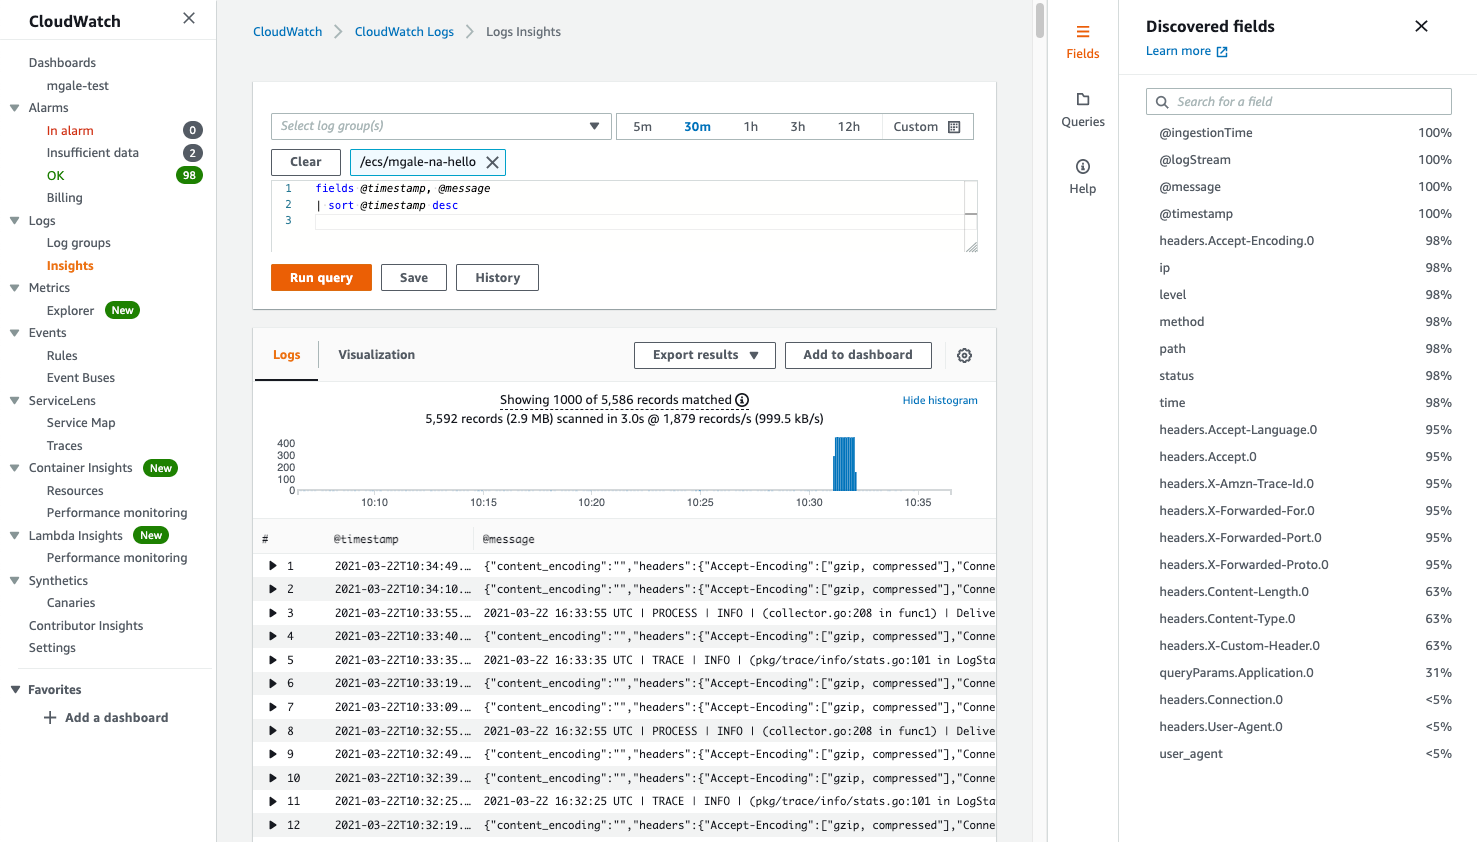
We don't need to waste time trying to parse out fields ourselves by figuring out the correct regex patten, we can jump straight into reports.
Comparing HTTP response codes returned by the web servers requires a single stats line:
|stats count(status) by status
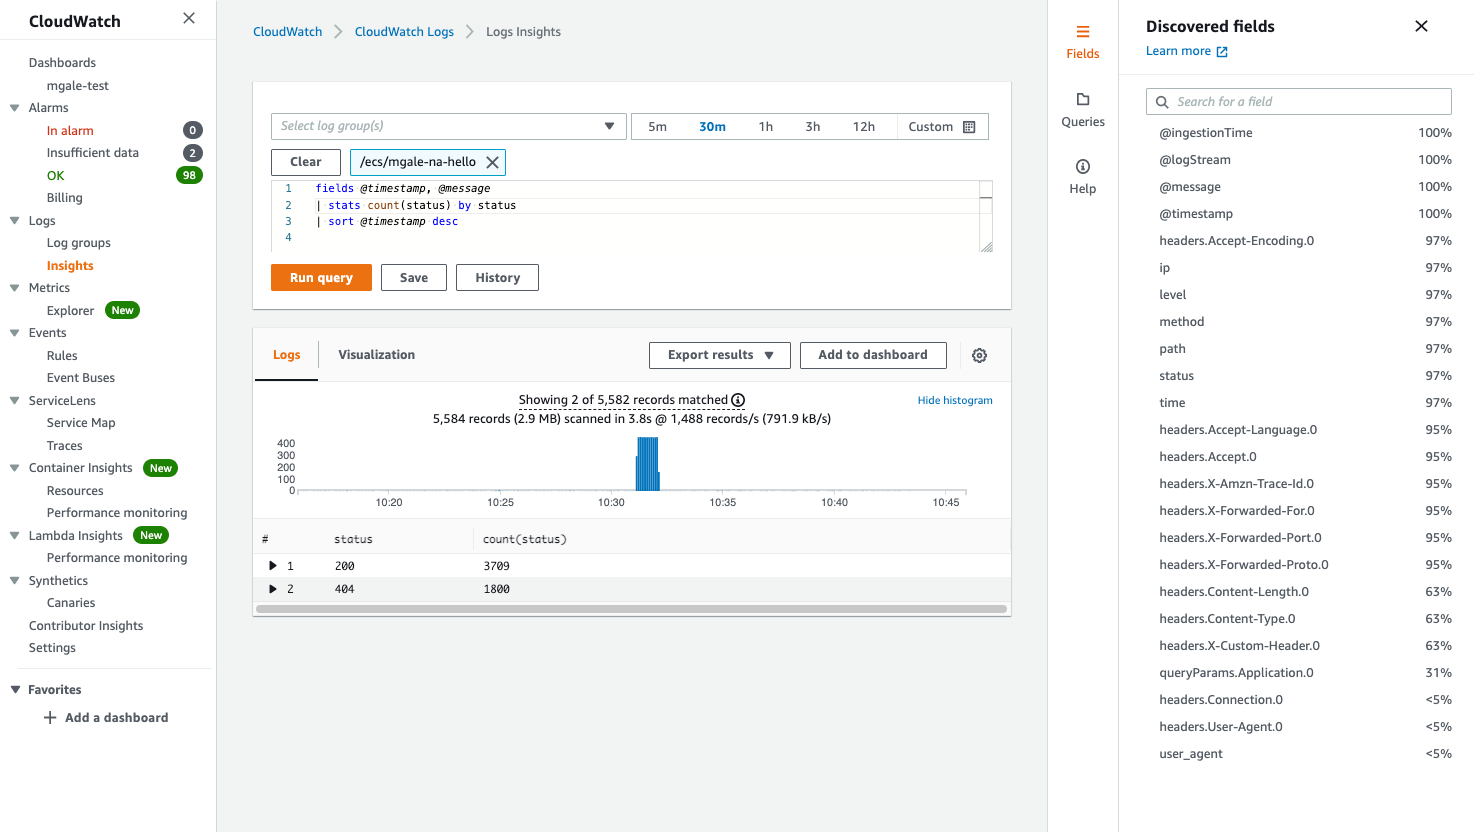
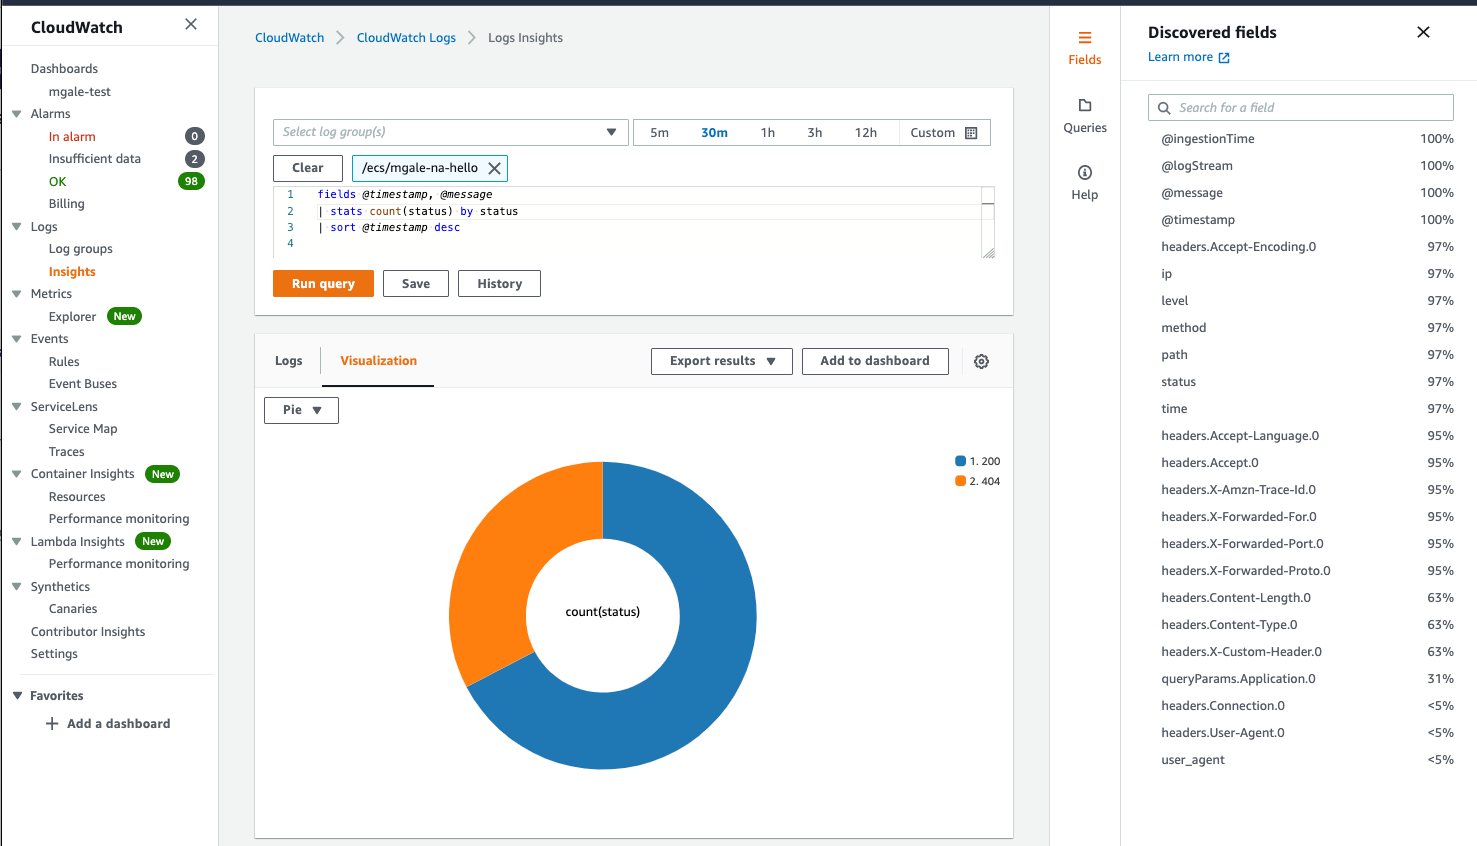
We can now click the Visualization tab to see a graph of our results and add it to a CloudWatch Dashboard if desired.
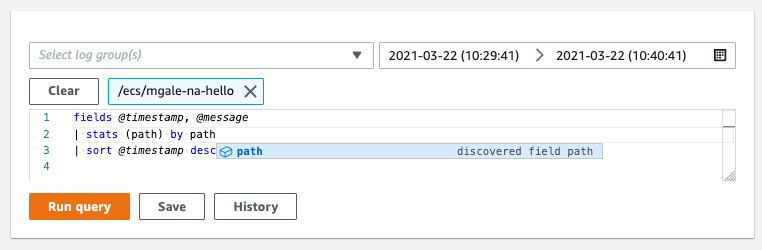
When writing queries in Insights the discovered fields show up automatically, this makes the interface extremely easy to use even for someone who is not familiar with the logs or regex.
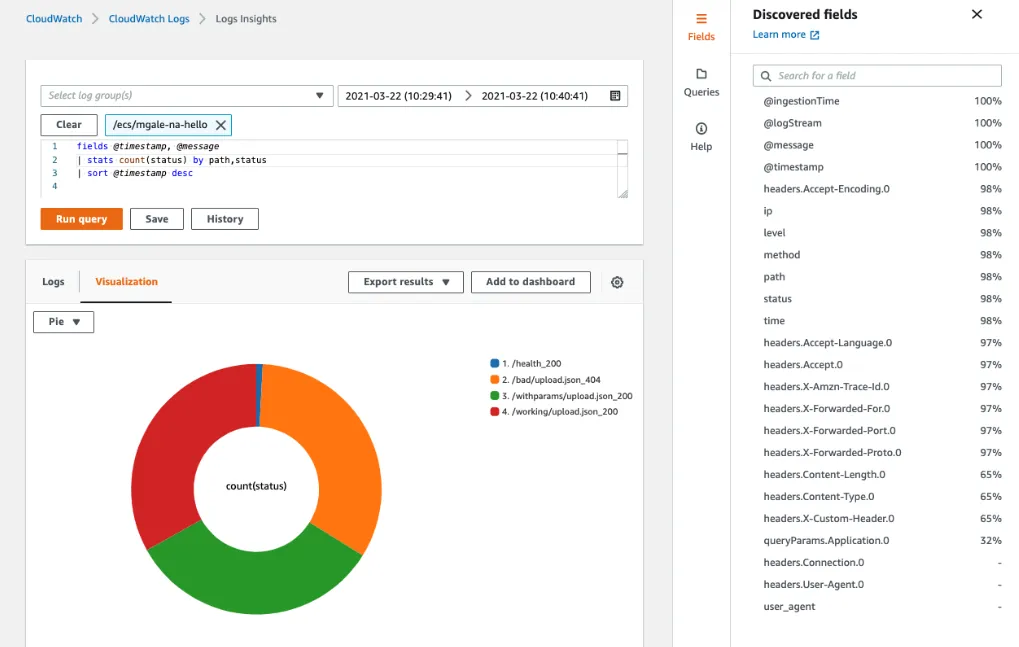
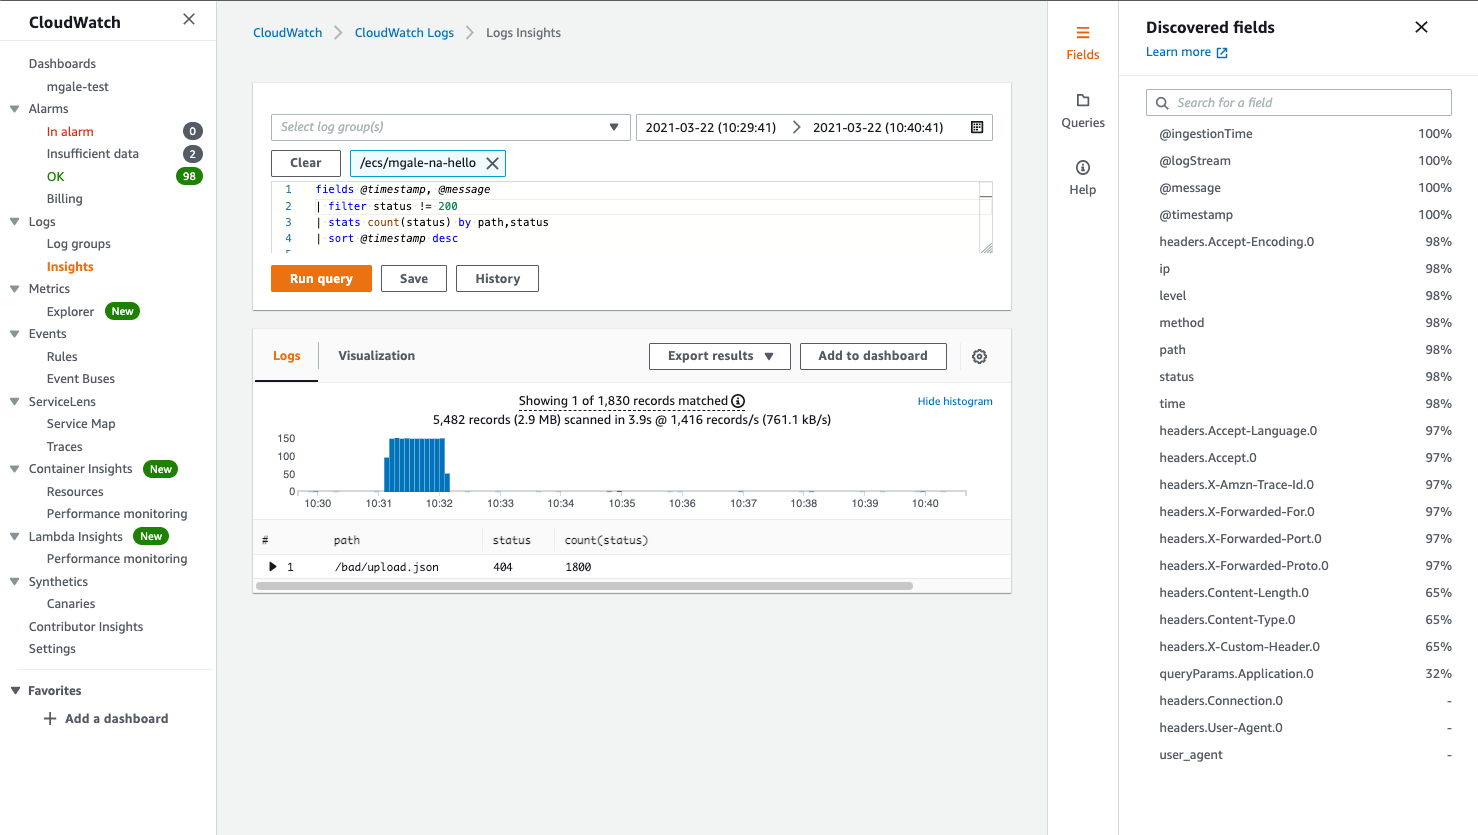
Below a single stats command has provided a count of HTTP responses by URL path using a group by directive with two discovered fields.
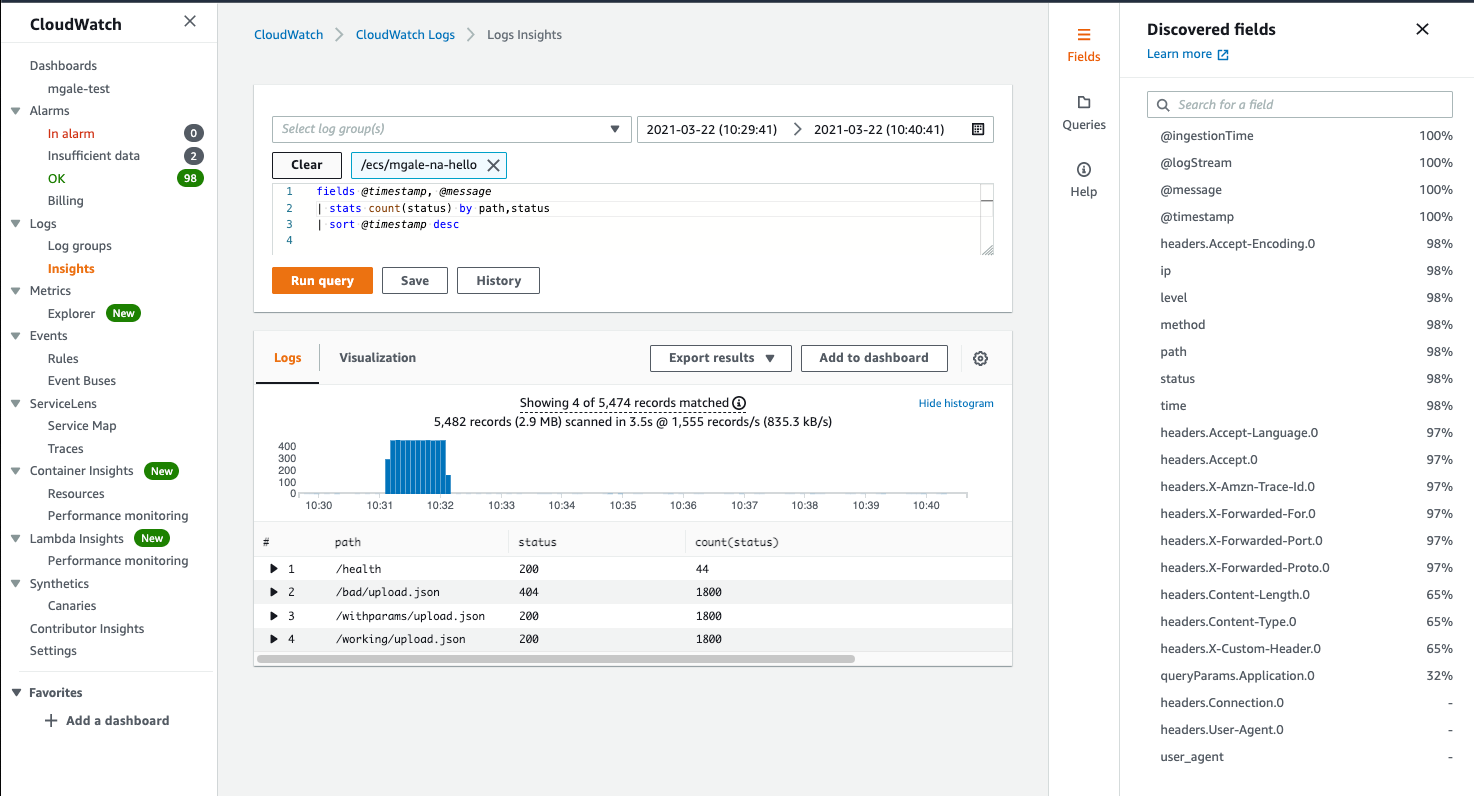
Here we use the discovered field status to filter out all successful HTTP requests and return a list of failed URL paths by status with a frequency count.
JSON arrays are flattened into lists
JSON arrays are flattened into lists of field names and values. An example of this can be seen below with the queryParams values.
The demo client made several HTTP requests with the URL query parameter name “Application” and the value is the text “TestApp” with a number from 1 to 5 appended.
CloudWatch takes the JSON list and provides a field called “queryParams.Application.0” which will hold the values.
-
queryParams is the JSON field we use to store the key-value pairs.
-
The word “Application” is the name of the parameter that is being sent in so CloudWatch uses it as a field name. The reason there is a zero (0) at the end is that parameter names can be repeated in the URL.
The query below provides a count of the unique values sent in using a single stats line.
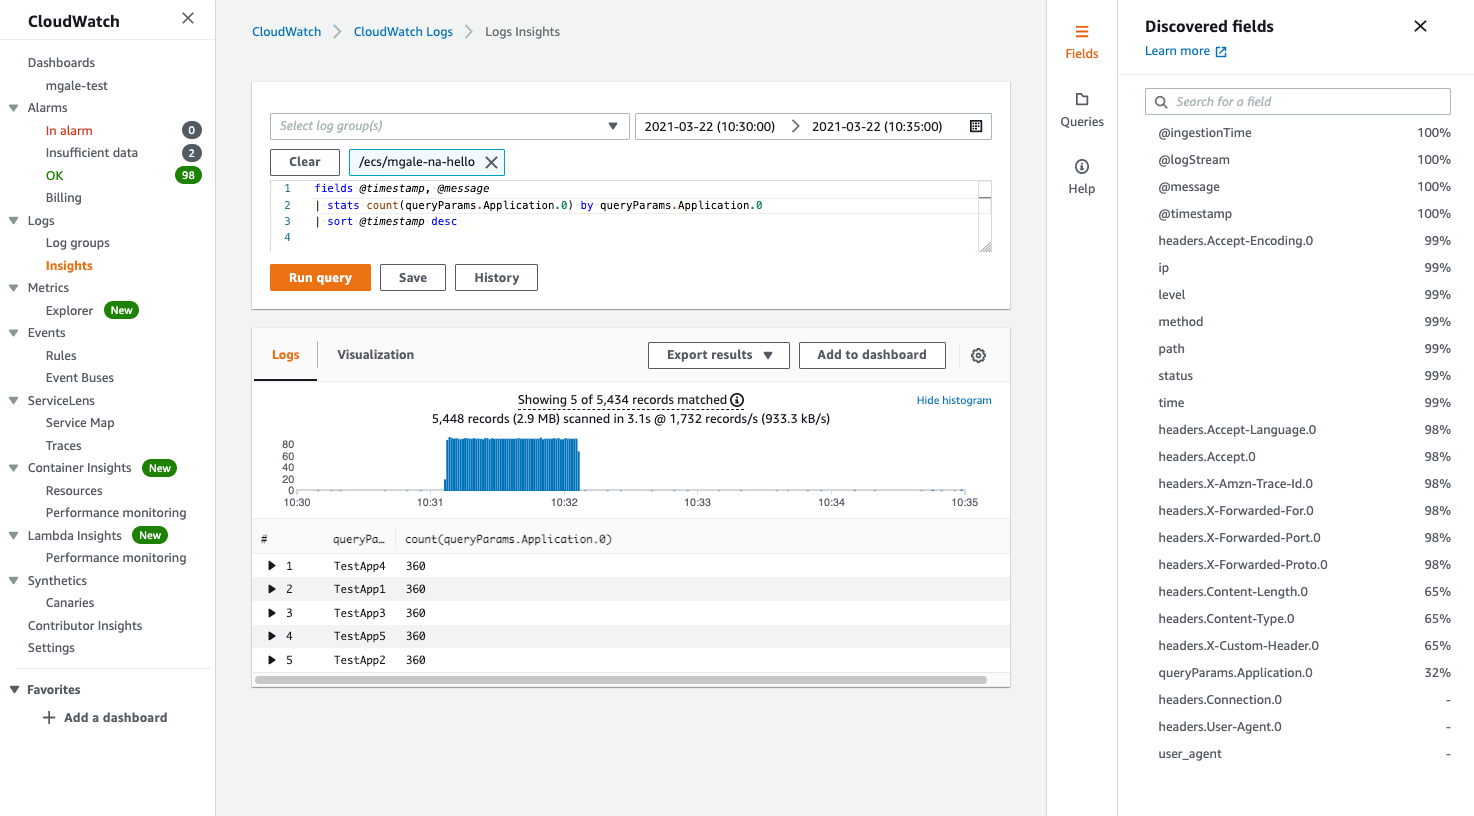
The above analysis would be extremely difficult, time-consuming, and error-prone with text-based logs and having to rely on regex parsing.
Conclusion
To recap we covered the benefits of switching to JSON logs and how CloudWatch Logs Insights makes this easy and well supported. We also covered a small example in GoLang demonstrating how easy the change can be.
Comments
Loading comments…