
In this article, we are going to be learning how to replace missing values in our Pandas data frame with predicted values using an ML Algorithm. I will be walking us through the simple steps required to achieve this. This is undoubtedly one of the most accurate and efficient methods for handling missing data. Depending on the class of data that is missing, one can either use a regression or classification model to predict missing data.
Watch the Video Below:
Need For Exploratory Data Analysis:
Exploratory Data Analysis is an important step before you proceed to machine learning or modelling your data. By doing this you can get to know whether the selected features are ready for modelling, are all the features required, are there any correlations based on which we can either go back to the Data Pre-processing step or move on to modelling?.
Steps In Exploratory Data Analysis In Python
There are several steps for conducting exploratory data analysis, this includes:
- Description of data
- Handling missing data
- Handling outliers
- Understanding relationships and new insights through plots
Handling Missing Data
But for this article, our main focus will be “handling missing data”.
Data in the real world are rarely clean and homogeneous. Data can either be missing during data extraction or collection due to several reasons. Missing values need to be handled carefully because they reduce the quality of any of our performance metrics.
- Drop NULL or missing values
- Fill Missing Values
- Predict Missing values with an ML Algorithm:
All methods described above except for the last method, might not eventually give us the accuracy we need during our data modelling. that’s why this article, focuses on handling missing data by Predicting Missing values with an ML Algorithm.
Steps to Follow for Predicting Missing Values
Here, we look at the simple steps required to achieve this.
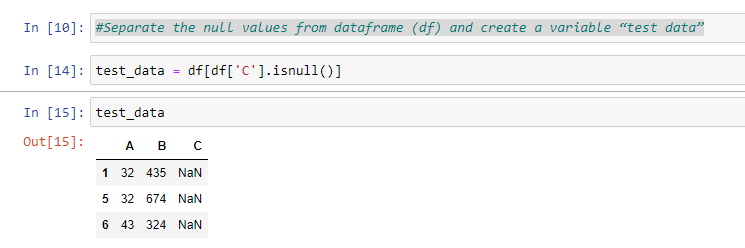
- Separate the null values from the data frame (df) and create a variable “test data”
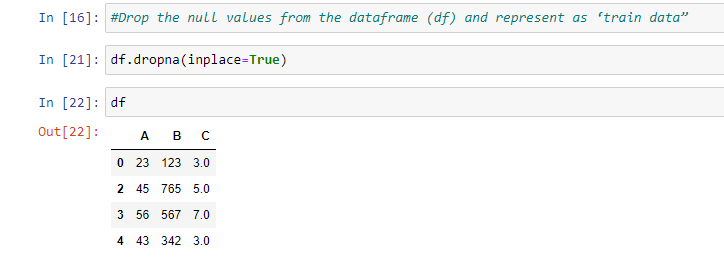
- Drop the null values from the data frame (df) and represent them as ‘train data”
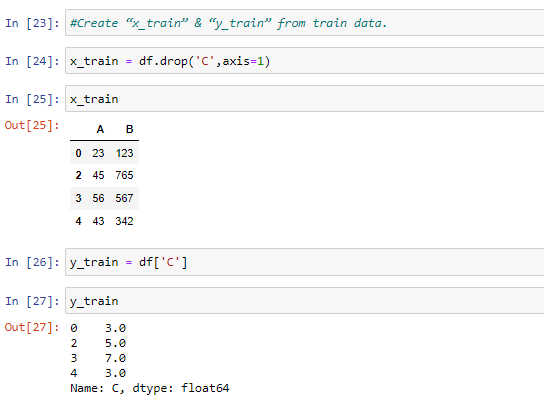
- Create “x_train” & “y_train” from train data
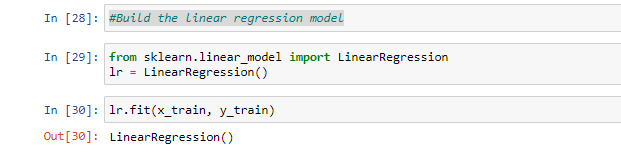
- Build the linear regression model
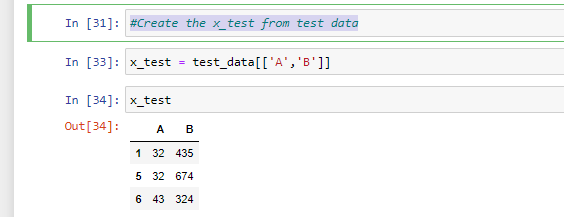
- Create the x_test from test data
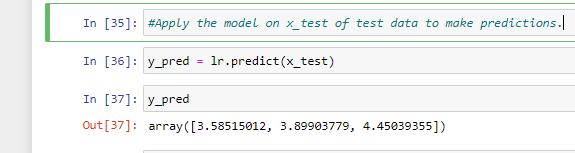
- Apply the model on x_test of test data to make predictions
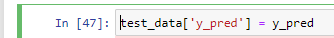
- Replace the missing values with predicted values.
Jupyter Notebook
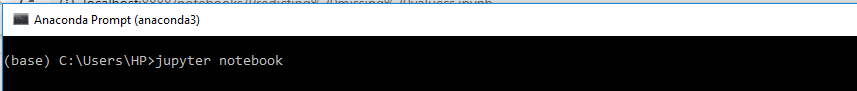
We will be working from the Jupyter Notebook. I will fire up my Jupyter Notebook from the anaconda3 prompt as shown below and then type in “jupyter notebook” as shown below, after which I will hit the ‘enter button’ on my keyboard :
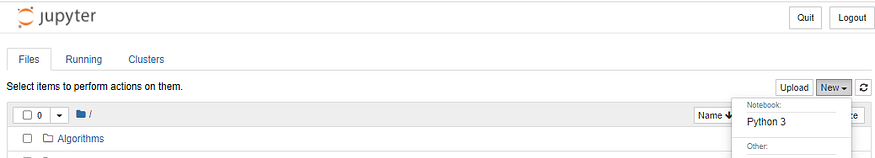
Create a new python 3 file:
Click on the “New” drop-down at the right corner as seen on the image below and select ‘Python 3:
Importing Pandas Library
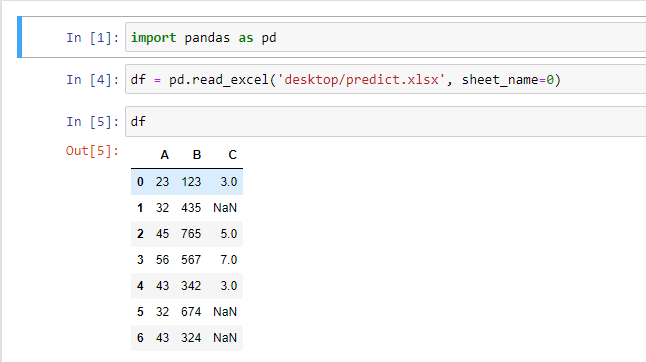
We are going to install the Pandas library using the command ‘import pandas as pd’. also, we will read an excel file as a data frame into our notebook as shown in the image below:
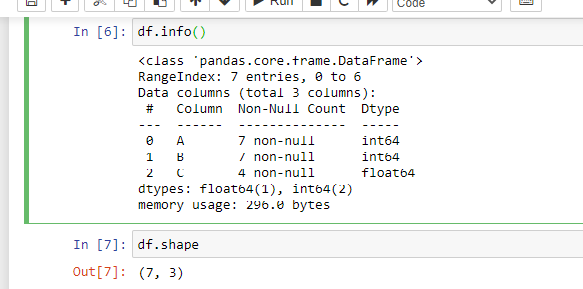
Let’s check more details about our data frame using the command df.info() and also df.shape
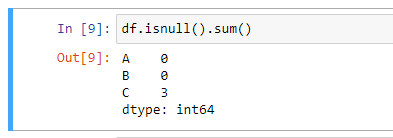
To reveal the number of null or missing values in our data frame, we use df.isnull().sum() as seen in the image below:
As you can see, we have in columns ‘A’ and ‘B’, 0 null values but in column ‘C’, we have 3 null values.
Steps to Predicting the Missing Data:
Step 1: Separate the null values from the data frame (df) and create a variable “test data”
Step 2: Drop the null values from the data frame (df) and represent them as ‘train data”
Step 3: Create “x_train” & “y_train” from train data.
In other to create the ‘x’ and ‘y_train’ From the data frame represented as train data, we would represent columns ‘A’ and ‘B” as x_train while column ‘C’ would represent our y_train as shown in the image below:
Step 4: Build the linear regression model
Step 5: Create the x_test from test data
In other to create the x_test from our test_data, the columns ‘A’ & ‘B’ would be represented as ‘x_test’ as shown in the image below:
Step 6: Apply the model on x_test of test data to make predictions. here, we have created a new variable ‘y_pred’.
Step 7: Finally, we replace the missing values with predicted values.
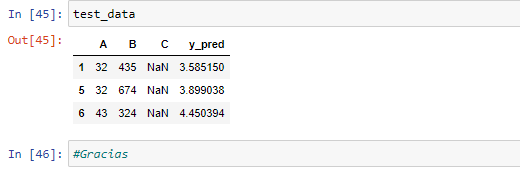
Now, we have come to the end of our prediction. Our predicted values are seen in the image above. [3.58515012, 3.89903779, 4.45039355].
Thank you for sticking with me thus far!
Visit my GitHub page to get this code.
Comments
Loading comments…