RFM analysis to hit target audience using customer segmentation.
Introduction
“Customer segmentation is the compass that guides marketing endeavors, revealing the unique constellations within the vast galaxy of consumer diversity, allowing brands to navigate the cosmos of personalized engagement.”
Sprocket Central is an Australian company that sells bicycles, they have a list of one thousand new customers and want to determine which new customers to target marketing efforts.
Customer segmentation means dividing customers into groups with common attributes like demographics or behavior. These divisions (segments) help marketers and sales reps be more effective.
Companies need to identify target audiences for their product offerings, they target segments rather than a whole market to get better payoffs. Precision improves marketing with personalized messages, better conversions, lower costs, and higher ROI.
Objectives
- To collect transaction data
- To calculate RFM scores
- To carry out segmentation from RFM scores
- To carry out segment analysis
- To determine which customers to target from our new customer list
Data Provided
There are three datasets made available for this analysis;
The transactions table contains over 19,000 transactions from three states for 2017
The Customer demographic table contains information such as customer_id, first_name, last_name, gender, date of birth (DOB), job_title, job_industry_category, wealth_segment, owns_car.
The Customer Address table contains information such as customer_id, address, postcode, state, and country.
The New customer list contains all information in the customer demographic and address table but no customer_id since they are not registered customers.
The dataset was imported into the SQL server, a little data cleaning was carried out and additional fields such as the age and age_group needed for the analysis were added.
Methodology
RFM analysis is a customer segmentation technique that evaluates customer behavior based on three key factors:
- Recency (how recently a customer made a purchase)
- Frequency (how often a customer makes purchases)
- Monetary Value (the total amount a customer has spent).
By assigning scores to each factor, customers are divided into distinct segments. This approach enables businesses to gain insights into customer engagement, loyalty, and spending patterns, allowing for tailored marketing strategies, personalized communication, and effective targeting of promotions to different groups, ultimately enhancing customer relationships and driving business growth.
The tool used; Microsoft SQL Server, Microsoft Excel
Analysis and Results
Segment Creation
I began by creating the foundations of this work, our customer segments. A total of ten customer segments were created for two reasons;
- Increasing the precision of the results can lead to more precise targeting and personalization of marketing efforts.
- A higher number of segments captures a wider range of customer behaviors, preferences, and needs.
The ten segments are;
- customer — these are average customers
- one time customers — these are customers that made one purchase a long time ago
- active loyal customers — they are our customers that make good purchases frequently and have a good recency score.
- slipping best customer — they are the best customers that have not made any purchase recently.
- Potential customers — they are customers who made a big purchase recently.
- best customers — they are the perfect customers with a high frequency of purchases, they have purchased recently and purchased a lot.
- churned best customer — they are the best customers who have not made any purchases for a long time and churned.
- new customers — they have made a very recent purchase and have a low-frequency score.
- lost customers — they are normal and loyal customers who have not made any purchases in a very long time.
- declining customers — they are customers who have not made a purchase recently.
These segments can be defined in any manner based on what a company is looking to identify.
With this in mind, I wrote the SQL query to derive our RFM score and then when further to create the segments.
-- USING RFM ANALYSIS FOR CUSTOMER SEGMENTATION

DROP TABLE IF EXISTS #RFM;
WITH RFM AS
(
    SELECT
        customer_id,
        MAX(transaction_date) Last_order_date,
        (select MAX(transaction_date) from kpmg.Transactions) Max_Transaction_Date,
        DATEDIFF(DD,MAX(transaction_date),(select MAX(transaction_date) from kpmg.Transactions)) Recency,
        COUNT(transaction_id) Frequency,
        SUM(list_price) MonetaryValue,
        AVG(list_price)AvgMonetaryValue
    FROM kpmg.Transactions
    GROUP BY customer_id
),
rfm_calc AS
(
    SELECT r.*,
        NTILE(4) OVER (ORDER BY Recency) rfm_recency,
        NTILE(4) OVER (ORDER BY Frequency) rfm_frequency,
        NTILE(4) OVER (ORDER BY MonetaryValue) rfm_monetary

    FROM RFM r
)
SELECT
    c.*, rfm_recency+rfm_frequency+rfm_monetary as rfm_cell,
    CAST(rfm_recency as varchar)+CAST(rfm_frequency as varchar)+CAST(rfm_monetary as varchar) rfm_score
INTO #rfm
from rfm_calc c

--CUSTOMER SEGMENTATION

SELECT customer_id, rfm_recency,rfm_frequency,rfm_monetary,rfm_score,
    case
        when rfm_score in (444,443,434,433) then 'churned best customer' --they have transacted a lot and frequent but it has been a long time since last transaction
        when rfm_score in (421,422,423,424,434,432,433,431) then 'lost customer'
        when rfm_score in (342,332,341,331) then 'declining customer'
        when rfm_score in (344,343,334,333) then 'slipping best customer'--they are best customer that have not purchased in a while
        when rfm_score in (142,141,143,131,132,133,242,241,243,231,232,233) then 'active loyal customer' -- they have purchased recently, frequently, but have low monetary value
        when rfm_score in (112,111,113,114,211,213,214,212) then 'new customer'
        when rfm_score in (144) then 'best customer'-- they have purchase recently and frequently, with high monetary value
        when rfm_score in (411,412,413,414,313,312,314,311) then 'one time customer'
        when rfm_score in (222,221,223,224) then 'Potential customer'
        else 'customer'
    end rfm_segment

FROM #rfm
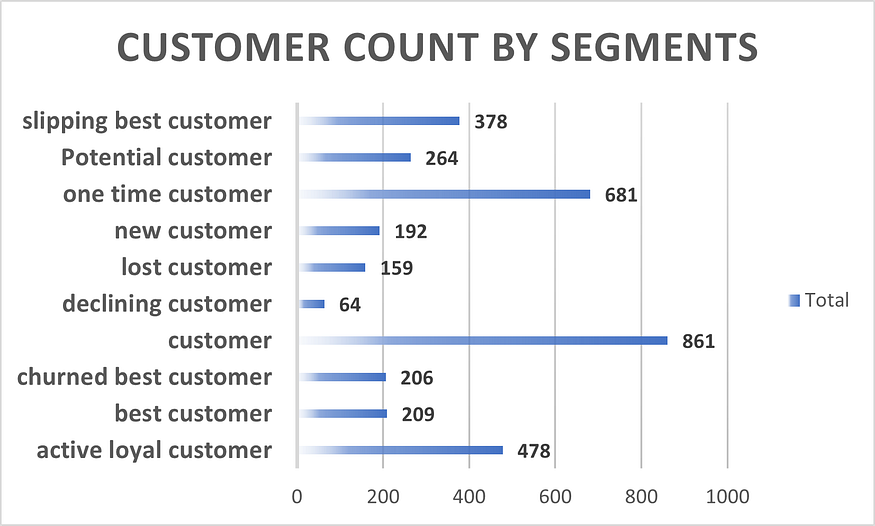
With the query above, I created all ten segments based on customer purchase behavior, the result was saved and added to the database as CustomerSegmentation. Let's see how they are distributed in our customer population.
SELECT rfm_segment, COUNT(customer_id) CUST_COUNTFROM kpmg.CustomerSegmentation
GROUP  BY rfm_segment
ORDER  BY CUST_COUNT DESC
visualizing the results;
Segment Analysis
In this section, I dived deeper to understand the characteristics and traits, as well as purchase patterns of the segments created, this gives us insights into our marketing strategy.
For the purpose of this analysis, I will only be working with three segments; the best customers, active loyal customers, and customers.
To understand our segments better, I will look at their characteristics in terms of age group, job_industry_category, wealth_segment, and car ownership, to understand which of these characteristics are dominant among segments.
I will also look at the purchase patterns to understand the types of products they buy, the average order value (which gives an idea of price sensitivity), and the time of year they tend to make purchases
Let’s dive deeper
The characteristics and traits of our chosen segments
- what is the age distribution of our target segments?
SELECT
    D.age_group, COUNT(CS.customer_id) AS Customer_Count
FROM
    kpmg.CustomerSegmentation CS
LEFT JOIN
    kpmg.CustomerDemographic D
ON
    CS.customer_id = D.customer_id
WHERE
    CS.rfm_segment IN ('best customer','active loyal customer','customer')
GROUP BY
    D.age_group
ORDER BY
    1 ASC,Customer_Count DESC
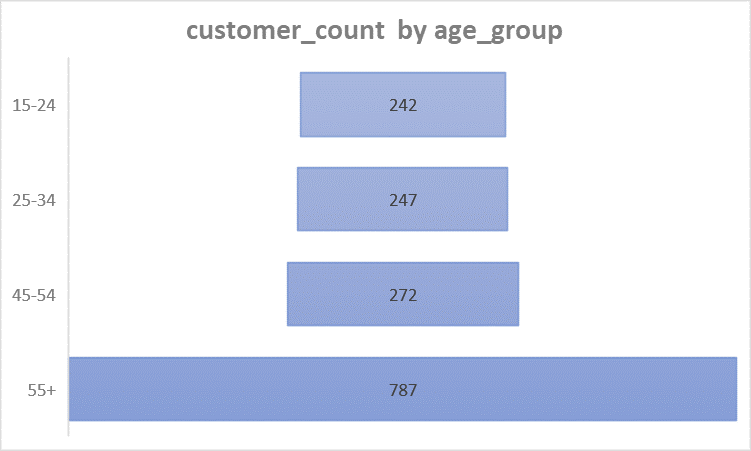
From the visual representation of our query result, we can see that our chosen segments are made up of people mostly above the age of 55.
- what is the location distribution of our target segments?
SELECT
    A.[state], COUNT(CS.customer_id) AS Customer_Count
FROM
    kpmg.CustomerSegmentation CS
LEFT JOIN
    kpmg.CustomerAddress A
ON
    CS.customer_id = A.customer_id
WHERE
    CS.rfm_segment IN ('best customer','active loyal customer','customer')
GROUP BY
    A.[state]
ORDER BY
    1 ASC,Customer_Count DESC
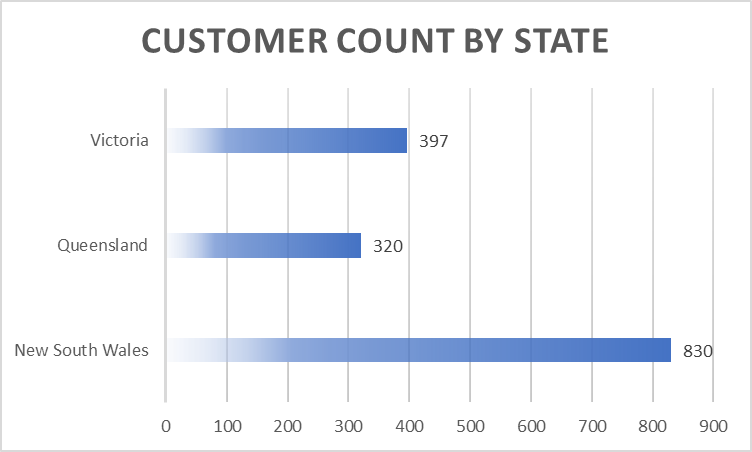
Our target segments are people mostly from the state of New south wales with 830 persons coming up second is Victoria with 397 persons.
- what is the job industry distribution of our target segments?
SELECT
    D.job_industry_category, COUNT(CS.customer_id) AS Customer_Count
FROM
    kpmg.CustomerSegmentation CS
LEFT JOIN
    kpmg.CustomerDemographic D
ON
    CS.customer_id = D.customer_id
WHERE
    CS.rfm_segment IN ('best customer','active loyal customer','customer')
GROUP BY
    D.job_industry_category
ORDER BY
    1 ASC,Customer_Count DESC
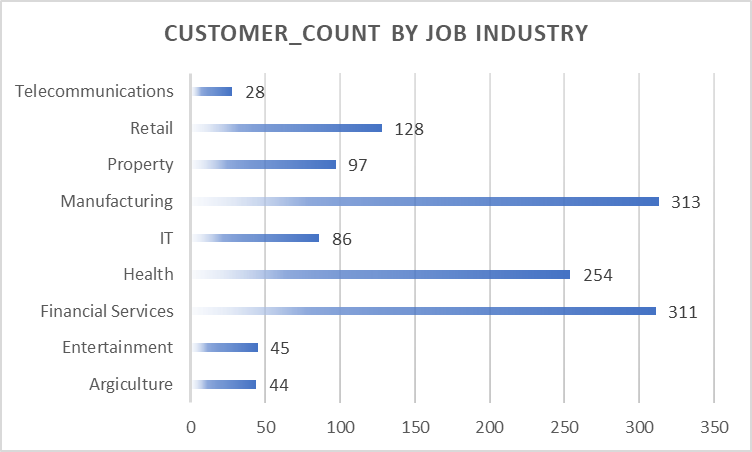
For the trait of the job industry, we have three categories to consider, these are Manufacturing, Health, and Financial Services, they make up a good portion of our target segment.
- what is the wealth segment distribution of the target segment?
SELECT
    D.wealth_segment, COUNT(CS.customer_id) AS Customer_Count
FROM
    kpmg.CustomerSegmentation CS
LEFT JOIN
    kpmg.CustomerDemographic D
ON
    CS.customer_id = D.customer_id
WHERE
    CS.rfm_segment IN ('best customer','active loyal customer','customer')
GROUP BY
    D.wealth_segment
ORDER BY
    1 ASC,Customer_Count DESC
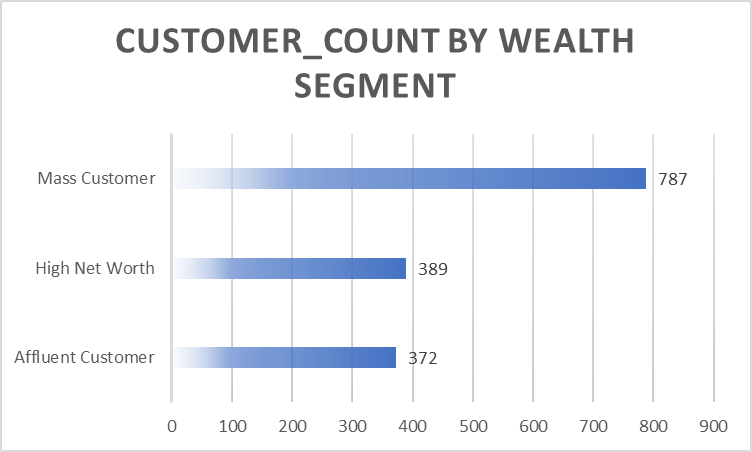
The majority of our target segment belongs to the mass customer wealth segment, with high net worth and affluent customers at even.
- Does car ownership have any effect on this segment?
SELECT
    D.owns_car, COUNT(CS.customer_id) AS Customer_Count
FROM
    kpmg.CustomerSegmentation CS
LEFT JOIN
    kpmg.CustomerDemographic D
ON
    CS.customer_id = D.customer_id
WHERE
    CS.rfm_segment IN ('best customer','active loyal customer','customer')
GROUP BY
    D.owns_car
ORDER BY
    1 ASC,Customer_Count DESC
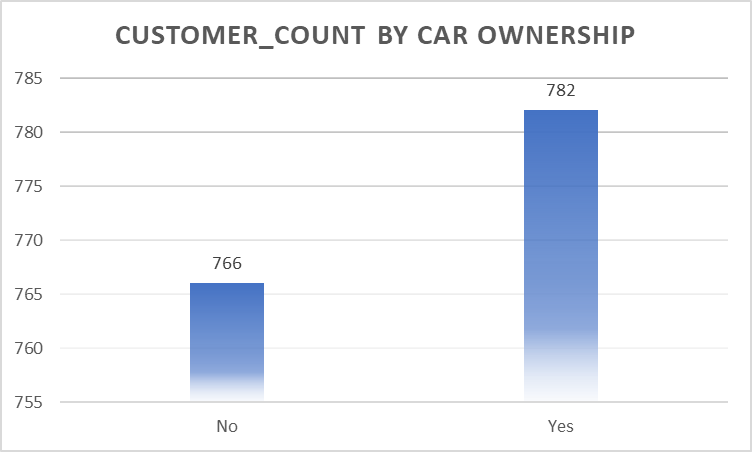
Looking at the numbers, the effect of car ownership is negligible, it can slightly be assumed that having a car has no impact on purchases from the target segment.
Purchase Patterns of our Segments
- What is the preferred brand of our target segment?
SELECT
    T.brand, COUNT(CS.customer_id) AS Customer_Count
FROM
    kpmg.CustomerSegmentation CS
LEFT JOIN
    kpmg.Transactions T
ON
    CS.customer_id = T.customer_id
WHERE
    CS.rfm_segment IN ('best customer','active loyal customer','customer')
GROUP BY
    T.brand
ORDER BY
    1 ASC,Customer_Count DESC

The Solex brand has the highest order volume among all brands in stock, but if we ignore this brand we can see that the other brands are at evens when comes to order volume.
- What is the preferred product line?
SELECT
    T.product_line, COUNT(CS.customer_id) AS Customer_Count
FROM
    kpmg.CustomerSegmentation CS
LEFT JOIN
    kpmg.Transactions T
ON
    CS.customer_id = T.customer_id
WHERE
    CS.rfm_segment IN ('best customer','active loyal customer','customer')
GROUP BY
    T.product_line
ORDER BY
    1 ASC,Customer_Count DESC

The visual representation of the query result shows that customers of this segment prefer products on the standard line, and the order volume is incomparable to the others.
- What is the Average order value?
SELECT
    AVG(T.list_price) AS avg_order_value
FROM
    kpmg.CustomerSegmentation CS
LEFT JOIN
    kpmg.Transactions T
ON
    CS.customer_id = T.customer_id
WHERE
    CS.rfm_segment IN ('best customer','active loyal customer','customer')
The results show that the average order value for our target segments is $1,102.69. This gives a hint at the price sensitivity of our audience.
- Are there any seasonal trends for our segments?
- seasonal trend

CREATE VIEW kpmg.quant_month AS
    SELECT
        t.transaction_id, t.customer_id,s.rfm_segment,
        YEAR(transaction_date) Year_id,
        MONTH(transaction_date) Month_id
    FROM
        kpmg.Transactions t
    JOIN
        kpmg.CustomerSegmentation s
    ON
        t.customer_id=s.customer_id
    WHERE
        s.rfm_segment IN ('best customer','active loyal customer','customer')
    GROUP BY
        transaction_id,t.customer_id,rfm_segment,transaction_date


SELECT
    Month_id,
    CASE
        WHEN Month_id = 1 THEN 'JANUARY'
        WHEN Month_id = 2 THEN 'FEBRUARY'
        WHEN Month_id = 3 THEN 'MARCH'
        WHEN Month_id = 4 THEN 'APRIL'
        WHEN Month_id = 5 THEN 'MAY'
        WHEN Month_id = 6 THEN 'JUNE'
        WHEN Month_id = 7 THEN 'JULY'
        WHEN Month_id = 8 THEN 'AUGUST'
        WHEN Month_id = 9 THEN 'SEPTEMBER'
        WHEN Month_id = 10 THEN 'OCTOBER'
        WHEN Month_id = 11 THEN 'NOVEMBER'
        WHEN Month_id = 12 THEN 'DECEMBER'
    ELSE '' END AS Month
    ,COUNT(transaction_id) Order_volume
FROM
    kpmg.quant_month
GROUP BY
    Month_id
ORDER BY
    Month_id
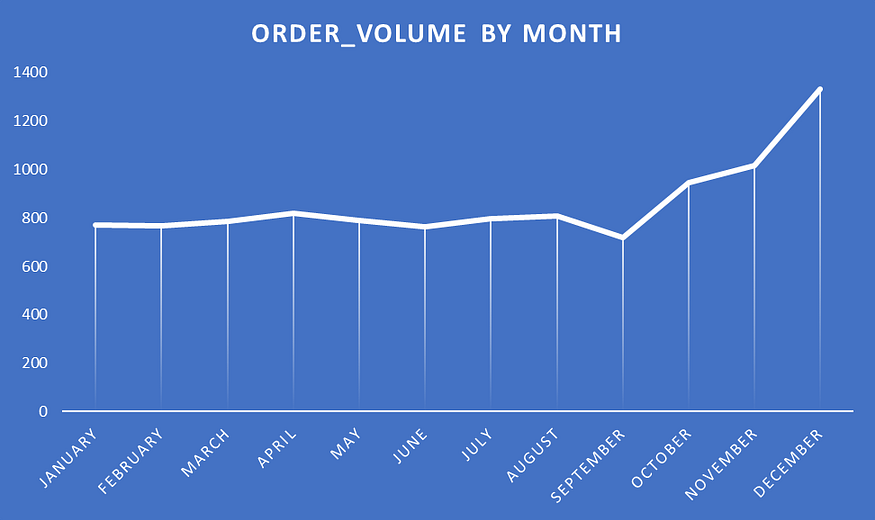
The answer is Yes, there is a seasonal trend. Customers in this segment tend to purchase more products towards the end of the year, specifically in the months of October, November, and December.
Discussion
Age Distribution: The majority of our chosen segments are composed of individuals aged 55 and above. This demographic insight can have implications for product preferences, communication strategies, and overall marketing approaches.
Geographic Segmentation: Our target segments are primarily located in the state of New South Wales, with a significant portion residing in Victoria as well.
Job Industry: The job industries of Manufacturing, Health, and Financial Services are prominent within your target segment.
Customer Wealth Segments: Your target segment comprises mainly Mass Customers, giving us an understanding of the economic diversity of your audience and tailoring your offerings accordingly.
Car Ownership: The data suggests that car ownership has a negligible impact on purchasing behavior within the target segment. This might imply that car ownership does not strongly influence buying decisions for this group.
Brand Preferences: The Solex brand has the highest order volume among all brands, but excluding Solex, the other brands have relatively similar order volumes. This information guides decisions regarding brand promotions and inventory management.
Product Line Preference: The visual representation indicates that customers in this segment prefer products from the standard line. This insight helps in focusing on specific product categories that resonate with the audience’s preferences.
Average Order Value: The average order value for your target segments is $1,102.69. This figure suggests that your audience is price-sensitive to some extent and that your pricing strategy should align with this sensitivity.
Seasonal Trends: A clear seasonal trend is identified in the data, where customers tend to purchase more products toward the end of the year, specifically in October, November, and December. This means our campaigns should be more active in these months to take advantage of the high purchase volume during the period.
With these insights in mind, we look through our new customers list to identify the most probable customer to target.
SELECT
    first_name,last_name,gender,address,postcode
FROM
    kpmg.NewCustomerList NC
WHERE
    state = 'NSW' AND age_group = '55+' AND
    wealth_segment = 'Mass Customer' AND job_industry_category IN
    ('Manufacturing','Health','Financial Services')
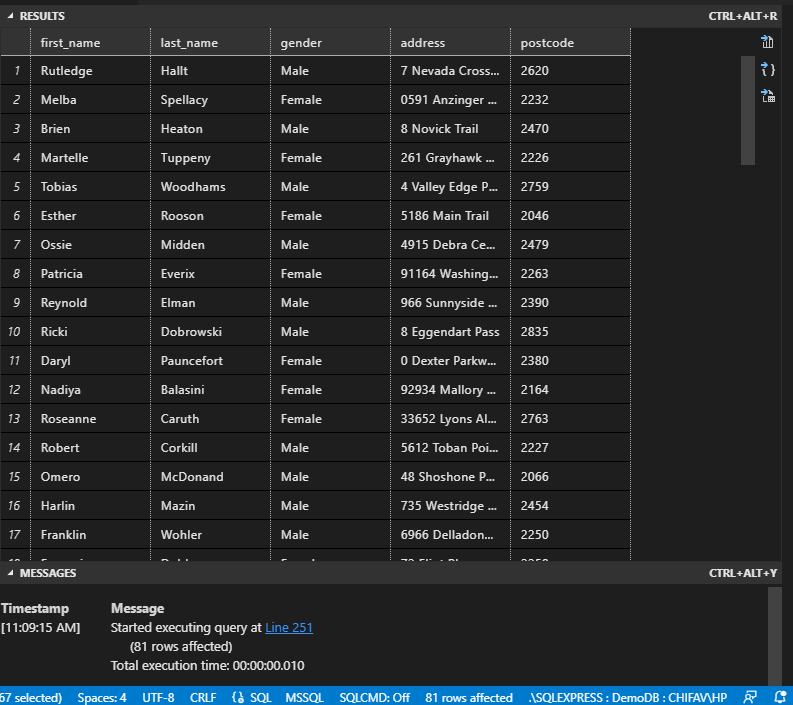
The query generated a list of 81 individuals from the list of 1000 customers that meet the characteristic traits of our target segments increasing the probability that they will be profitable customers if brought on board.
With the insights on the purchase pattern we got from our analysis, we can make the following inferences on how to target them.
- Given the observed average order value of $1,102.69 and the hint of price sensitivity, emphasize the value your products offer. Highlight cost-effectiveness, durability, and long-term benefits to resonate with the audience’s desire for meaningful purchases.
- Since you’ve identified a seasonal trend in purchasing behavior, design a special “Year-End Celebration” campaign that capitalizes on the preference for purchasing in October, November, and December. Offer limited-time promotions, discounts, and exclusive bundles to incentivize purchases during this period.
- Focus your marketing efforts on the “Standard Line” of products, which is preferred by your target segment. Highlight how these products meet their needs and offer the best value.
Conclusion
The importance of data in decision-making can never be overemphasized, the larger a company gets the more it depends on data for decision-making.
Effective marketing depends majorly on insights from available data, the project has shown an example of how data can be used to find the most probable target audience and make inferences on how to target them.
The precision of such analysis increases when we have more data available. This study focused only on demographics and behavior traits, but an even deeper study could focus on psychographics — this refers to the motivation behind purchases.
THANK YOU!
Connect with me on LinkedIn
Follow me here and check out my Medium profile for more interesting projects.
Comments
Loading comments…