Cryptocurrency trading has exploded in recent years as it shows tremendous potential and opportunities. It is true that it is still in its baby form which means there are still many areas to explore and exploit. In this article, we will first understand the logic behind cryptocurrencies before creating an indicator and back-testing its profitability as a systematic trading strategy.
I have just published a new book after the success of New Technical Indicators in Python. It features a more complete description and addition of complex trading strategies with a Github page dedicated to the continuously updated code. If you feel that this interests you, feel free to visit the below link, or if you prefer to buy the PDF version, you could contact me on Linkedin. The Book of Trading Strategies Amazon.com: The Book of Trading Strategies: 9798532885707: Kaabar, Sofien: Bookswww.amazon.com
Quick Introduction to Cryptocurrencies
Cryptocurrencies (Cryptography + Currencies) are a form of electronic money created with the intent to facilitate some tasks and transfers. As the name suggests, they are usually associated with the fact of hiding one’s identity. As there is no middle man between the transactions, the costs tend to be cheaper than government-issued fiat currencies.
In order to ensure authenticity and avoid fraud, users can record and verify at the same time their transactions as well as the transactions of others. These recordings are known as ledgers and are public to everyone for transparency purposes. The first cryptocurrency is the well known Bitcoin, created by the simultaneously known and unknown Satoshi Nakamoto.
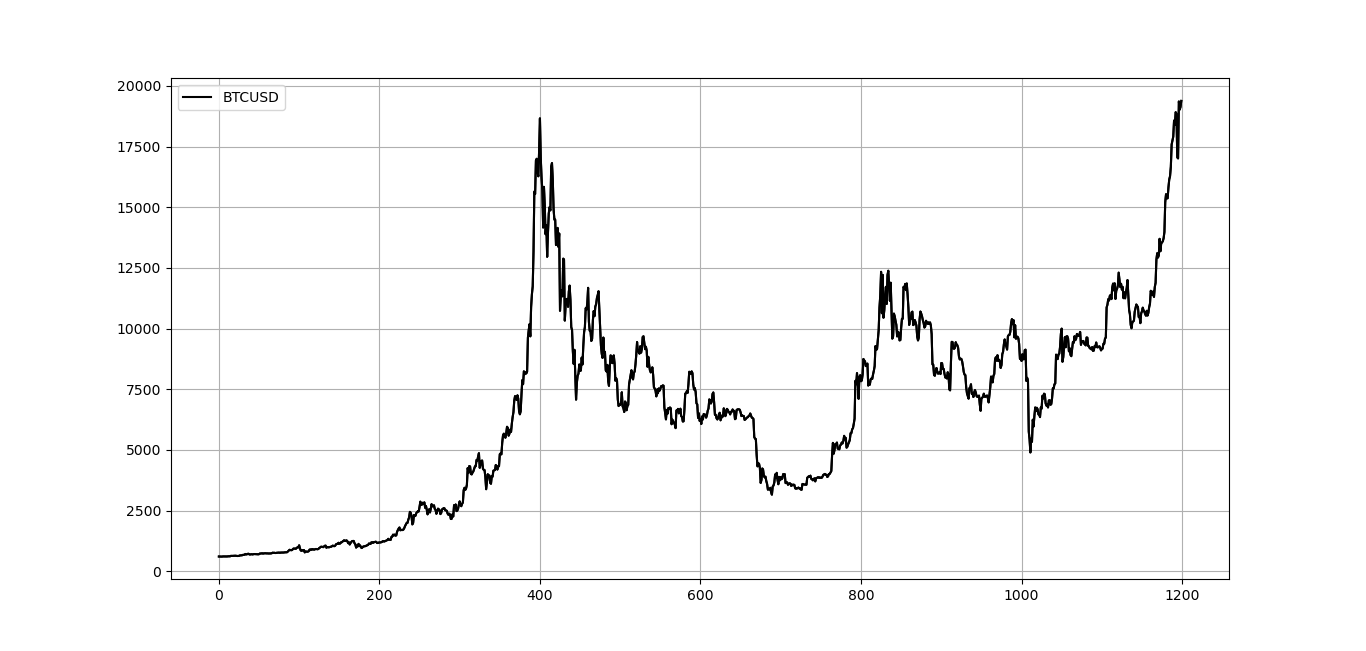 Bitcoin in USD terms -BTCUSD. (Image by Author)
Nowadays, there are a lot of cryptocurrencies trading with the known ones such as BTCUSD and ETHUSD and the lesser known ones such as Cardano and Dogecoin.

The next part will discuss the indicator we will be creating from scratch before applying it to Bitcoin, Ethereum, and Ripple. Finally, we will be able to evaluate the efficiency of the strategy we have created.
Creating the Indicator
Crypto trading is constantly evolving and many traders are interested in diversifying their knowledge and portfolios by including cryptocurrencies. This has prompted an explosion in the number of trades, thus, lowering costs and giving way to more liquidity. We will present an indicator that I have found to work quite well on cryptocurrencies within given risk management conditions. Let us first present the intuition of the indicator.
Every action must have a reaction and therefore an up move should have a corrective down move. The question is: When and what is the magnitude? The answer to that question is complicated but we can try to approach it with simple tools. Perfection is non-existent in financial dictionnaries but by time we can reach satisfactory strategies if we remain focused and disciplined.
This formula can also be found when calculating the Relative Vigor Index and thus I take no credit in it, also I have named it temporarily the Real Range Indicator until I find out if it exists already or not (in that case, all credits go to its creator). The Real Range Indicator is calculated following this formula:
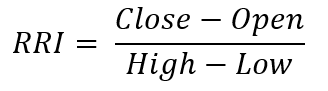 Image by Author.
The function in Python is very simple. We have to use it on an OHLC (Open, High, Low, Close) array, then the function will select a column using the where variable and then apply the formula. Remember that the fourth column Data[i, 3] refers to the closing price, the first column Data[i, 0] refers to the opening price, the second column Data[i, 1] refers to the high, and the third column Data[i, 2] refers to the low. This is because Python’s indexing starts at zero.
def rri(Data, where):

    for i in range(len(Data)):

        Data[i, where] = (Data[i, 3] - Data[i, 0]) / (Data[i, 1] - Data[i, 2])

    return Data
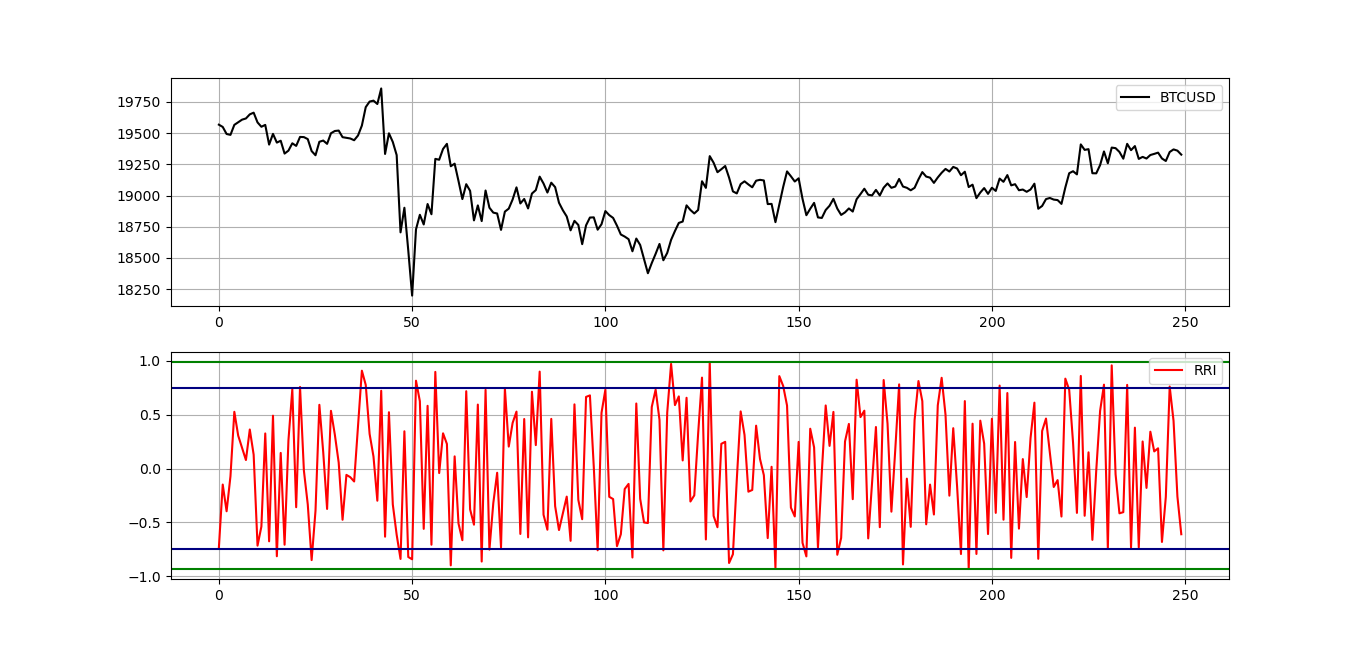 BTCUSD versus the RRI. (Image by Author)
It looks like we can form a boundary around 0.75 and -0.75 and this seems to work on other pairs as well. This is to be expected considering the formula of the RRI. Hence, the trading conditions can be the following:
-
Go long (Buy) whenever the RRI reaches -0.75 with the previous value being above -0.75. Hold this position until getting another signal or getting closed out due to risk management mentioned above.
-
Go short (Sell) whenever the oscillator reaches 0.75 with the previous value being less than 0.75. Hold this position until getting another signal or getting closed out due to risk management mentioned above.
def signal(Data, what, buy, sell):
  for i in range(len(Data)):

      if Data[i, what] < lower_barrier and Data[i - 1, what] > lower_barrier and Data[i - 2, what] > lower_barrier :
          Data[i, buy] = 1

      if Data[i, what] > upper_barrier and Data[i - 1, what] < upper_barrier and Data[i - 2, what] < upper_barrier :
          Data[i, sell] = -1
The **Data **variable refers to the OHLC array
The **what **variable refers to the column containing the RRI
The **buy **variable refers to where to put buy orders
The **sell **variable refers to where to put sell orders
Also, to make this a trading system rather than just systematic signals, I will add a risk management component using the Exponential Average True Range that we have seen together in previous articles.
If you are also interested by more technical indicators and using Python to create strategies, then my best-selling book on Technical Indicators may interest you: New Technical Indicators in Python Amazon.com: New Technical Indicators in Python: 9798711128861: Kaabar, Mr Sofien: Bookswww.amazon.com
Back-testing the Strategy
The way I use systematic strategies is to give the algorithms space to breathe and therefore I violate my very own first rule of risk-reward ratio. I generally target 1x eATR and risk 4x eATR as opposed to the normal target at 2x ATR and stop a 1x ATR. The entry triggers will be based on signals generated following the above conditions and the exit triggers are initiated whenever we reach the target, get stopped-out, or get another signal.
The first back-test done on the BTCUSD using M15 data since November 2019 has given the following results:
 Performance Summary Table. (Image by Author)
Now, let us analyze more the performance. Given that we have imposed a low risk-reward ratio by forcing the stop-loss orders to be four times as big as the profit orders, the hit ratio is naturally high around 66%. The expectancy is a measure that takes into account the historical average gain and loss per trade weighed by the hit ratio and thus, every time we initiate a trade, we can expect to gain $3.42. The profit factor must be above 1.00 which is the case. It is simply the gross profit over the gross loss. The realized risk-reward ratio was 0.60 which is much lower than the minimum optimal ratio of 2.00.
The trades were numerous with 6700 in a year. And finally, the break-even hit ratio is the minimum ratio we must obtain to be profitable. As long as it is less than the realized hit ratio, we can expect to have a winning strategy.
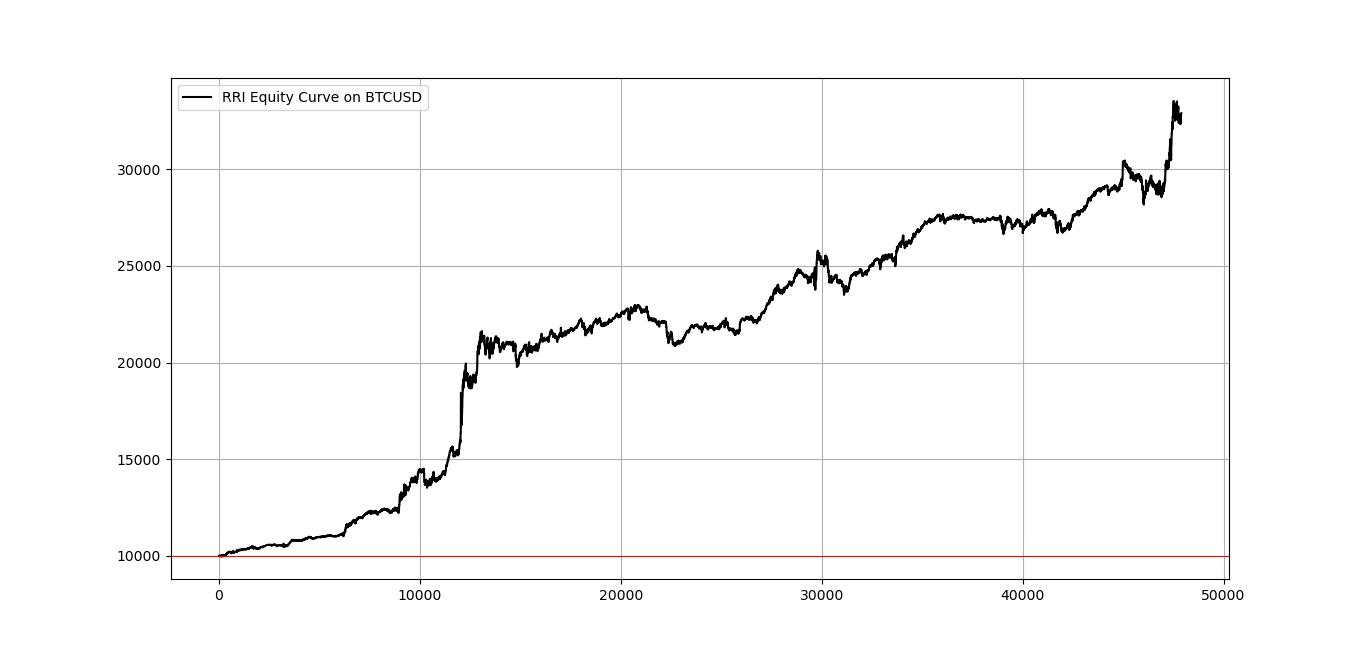 Equity Curve on the BTCUSD. (Image by Author)
How about we extend the back-test to include Ethereum versus the USD? We get the following results.
 Performance Summary Table. (Image by Author)
If we interpret the above results, we can say that on each trade, we can expect to gain $0.39 based on the 6983 previous trades. The below shows the equity curve on ETHUSD by trading on the M15 time frame.
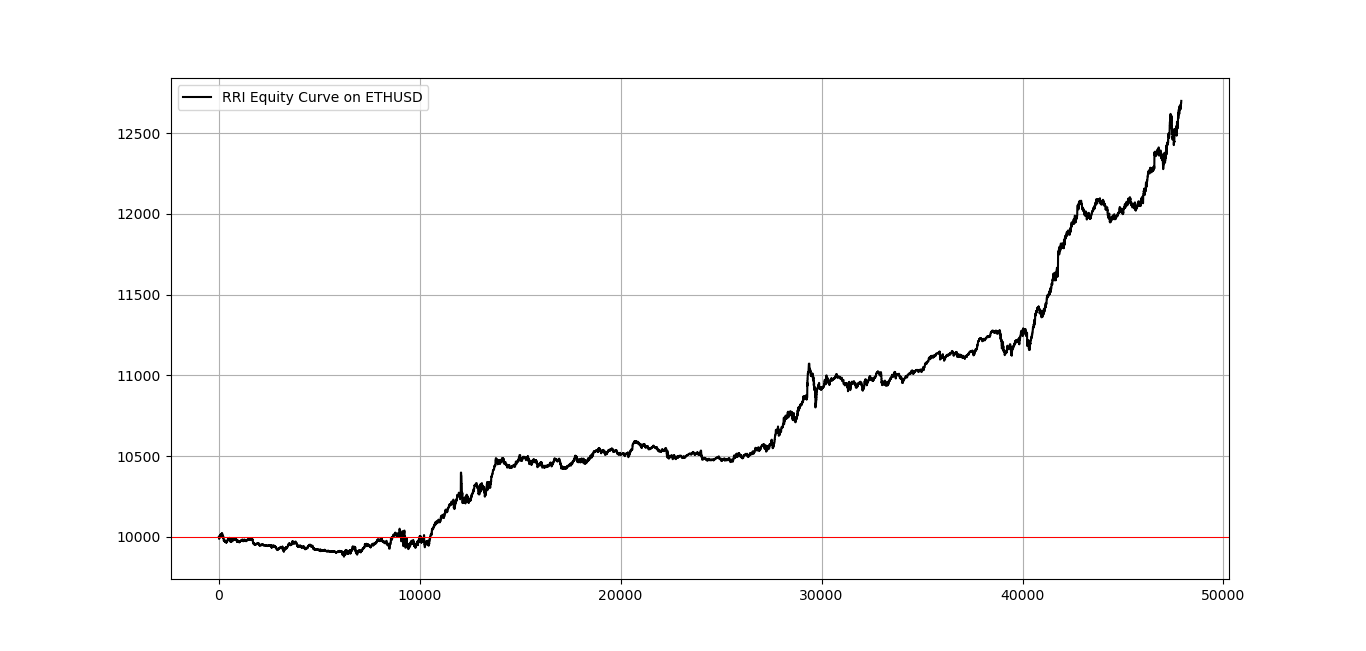 Equity Curve on the ETHUSD. (Image by Author)
Now, I am no cryptocurrency trading expert, but I believe that some pairs such as Ripple (XRPUSD) require some leverage to magnify the results, otherwise they will not return much, assuming a stable quantity of 1 XRP per trade. Hence, in the following back-test, the results were magnified by leverage.
 Performance Summary Table. (Image by Author)
Again, we can see a tendancy of positive results. Ignoring the low transaction costs on cryptocurrencies, we can say that the RRI adds value as a systematic strategy. It is worth mentioning that the strategy works on higher time frame with the exception of Daily and above.
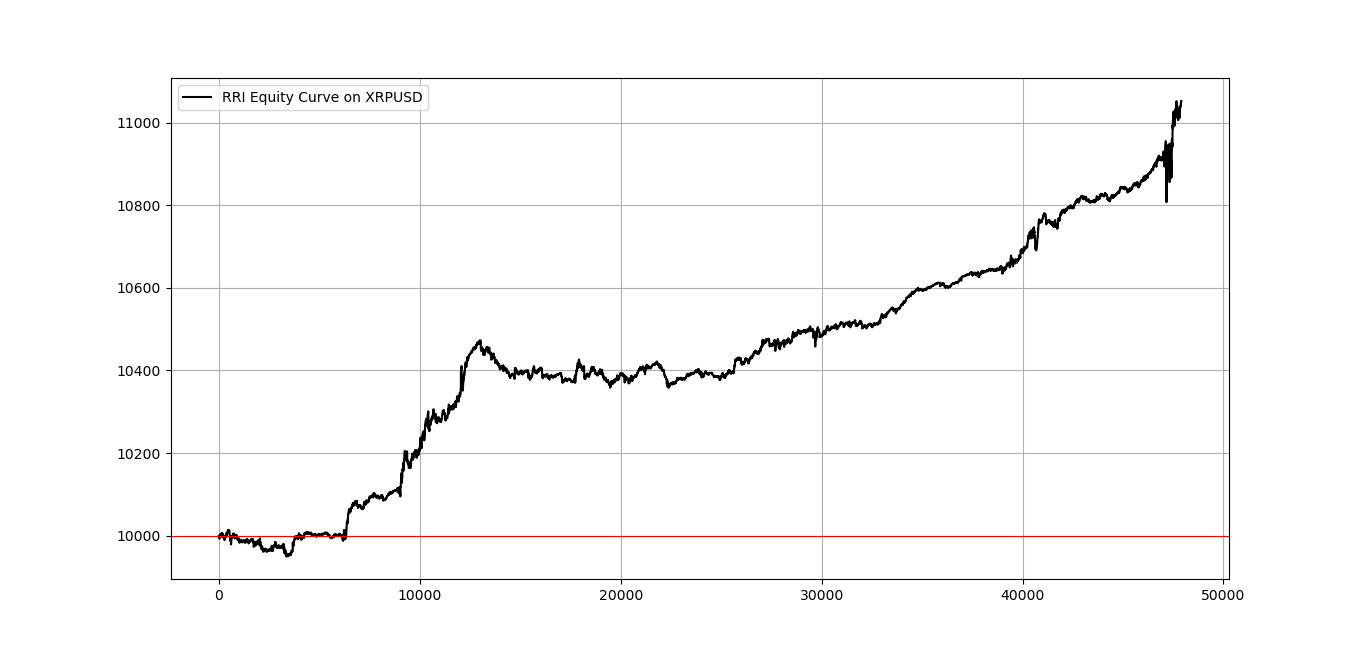 Equity Curve on the XRPUSD. (Image by Author)
Visibly, the RRI delivers some good results that can be further optimized using the triggers and the risk management process. One advantage seems to be clear with this indicator and it is the fact that we do not need to choose a lookback period as it is always the same.
Conclusion
Why was this article written? It is certainly not a spoon-feeding method or the way to a profitable strategy. If you follow my articles, you will notice that I place more emphasize on how to do it instead of **here it is **and that I also provide functions not full replicable code. In the financial industry, you should combine the pieces yourself from other exogenous information and data, only then, will you master the art of research and trading.
I always advise you to do the proper back-tests and understand any risks relating to trading. For example, the above results are not indicative as the spread we have used is very competitive and may be considered hard to constantly obtain in the retail trading world (but not impossible). However, with institutional bid/ask spreads, it may be possible to lower the costs such as that a systematic medium-frequency strategy starts being very profitable .You must never expect guaranteed returns and it is your sole responsibility to generate your own signals.
 Photo by André François McKenzie on Unsplash
Comments
Loading comments…