Introduction
Whenever a user wants to share his opinion regarding any trending topic on social media, we try to find the sentiment score of that expressed opinion using sentiment analysis. Twitter is the most widely used micro-blogging social media platform, having nearly 145 million daily active users. Nowadays, the user posts the tweets using hashtags, emoticons, abbreviations, and puns, which gets challenging to analyze the tweet and formulate sentiment scores.
In this article, I tried to perform Vader sentiment analysis along with tweepy on twitter data, which is a Python-based approach. This twitter sentiment analysis is basically for the market research, how it is ? you will get when you read it thoroughly.
Table of Contents
-
What is the Sentiment Analysis?
-
What is VADER?
-
Vader Installation
-
What is Tweepy?
-
Twitter Sentimental Analysis model
-
Observations
-
Conclusion
Let’s get ready for the sentimental analysis journey,
1. What is Sentimental Analysis?
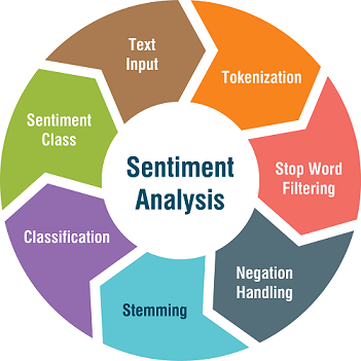
Sentiment analysis is the technique to calculate the sentiment score of any specific statement. Using NLP cleaning methodologies, we derive the meaningful opinion from the text then calculates the sentiment score of that opinion, and based on sentiment score, we classify the nature of the judgment is positive, negative, and neutral.
While performing twitter sentimental analysis, we have to deal with real-time tweets data extracted from different twitter accounts.
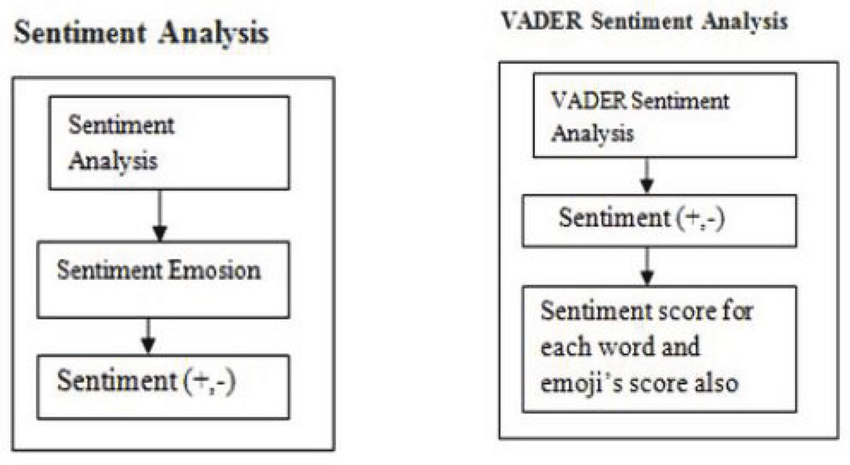
2. What is VADER?
 Source:- pinterest.com
**VADER **stands for Valence Aware Dictionary and sEntiment Reasoner. Vader performs well for the analysis of sentiments expressed in social media. These sentiments must be present in the form of comments, tweets, retweets, or post descriptions, and it works well on texts from other domains also.**VADER **is a lexicon and rule-based analysis tool.
There are different types of sentiment analysis techniques available for extracting meaning insights from the text data, but the VADER sentiment performs well mainly on social media data. Later on, we design our VADER sentiment model, which extracts features from twitter data, formulate the sentiment score, and classifies them in positive, negative, neutral classes.
Let’s start with the implementation,
3. VADER Installation
We install Vader by using pip command:
pip install vaderSentiment
After the successful installation of vaderSentiment, call the **SentimentIntensityAnalyser **object,
from vaderSentiment.vaderSentiment import SentimentIntensityAnalyzer

analyser = SentimentIntensityAnalyzer()
Let us analyze some statements using VADER now. We are using the polarity_scores() method to calculate the sentiment score for given sentences.
analyser.polarity_scores("I am getting bored in the quarantine.")
You see the output like in the form of a dictionary,
**{'neg': 0.259, 'neu': 0.741, 'pos': 0.0, 'compound': -0.2732}**
-
By analyzing the output above, we can state that our given statement is 74% neutral, 26% negative, and 0%positive. On the overall, our statement falls under the neutral category.
-
The Compound score is a metric that has been scaled between -1 as the most extreme negative score and +1 as the most extreme positive score. You can refer to the compound score methodology below.
 Compound Score methodology
read here for more details on the VADER scoring methodology.
analyser.polarity_scores("This quarantine is completely bored.")
analyser.polarity_scores("This quarantine is exciting.")
Here, you see the power of VADER scoring methodology, above both, the statements are exactly opposite in meaning, and the sentiment scores derive the same insights.
{'neg': 0.374, 'neu': 0.626, 'pos': 0.0, 'compound': -0.3384}
{'neg': 0.0, 'neu': 0.484, 'pos': 0.516, 'compound': 0.4939}
Let’s try VADER for statements in different languages apart from English,
#In Hindi
analyser.polarity_scores("मैं संगरोध में ऊब रहा हूं।")

#In Spanish
analyser.polarity_scores("Estoy aburrido en cuarentena")

#In German
analyser.polarity_scores("Ich bin gelangweilt in Quarantäne")
Checking the output,
{'neg': 0.0, 'neu': 1.0, 'pos': 0.0, 'compound': 0.0}

{'neg': 0.0, 'neu': 1.0, 'pos': 0.0, 'compound': 0.0}

{'neg': 0.0, 'neu': 1.0, 'pos': 0.0, 'compound': 0.0}
Yes, we got the same sentiment score for the statement in every language. Don’t worry; this is just for fun.
VADER analyses sentiments primarily based on specific key points:
-
Punctuation
-
Capitalization
-
Degree Modifiers
-
Conjunctions
-
Preceding Tri-gram
read here for more details on vital dependent points.
4. What is Tweepy?
 Source:- https://www.tecoed.co.uk
Tweepy is the most easy-to-use Python library for accessing the functionalities provided by the Twitter API.
Installation
The simplest way to install tweepy is to use pip command:
pip install tweepy
5. Twitter Sentimental Analysis Model
 Source:- pinterest.com
For fetching the real-time data from twitter, the sentiment model must require all requests to use OAuth for Authentication. Tweepy provides functionalities in a more straightforward way for Authentication. To design the VADER sentiment model, we need to register our client application with Twitter. If you are not aware of it then no problem, follow the below authentication process.
Authentication:
Follow these steps for the registering twitter client application :
-
Open https://developer.twitter.com/apps and click on the button: ‘Create New App.’
-
Fill all the required application details.
-
Once the app is created, you will be redirected to the app page.
-
Open the ‘Keys and Access Tokens’ tab.
-
Copy ‘Consumer Key’, ‘Consumer Secret’, ‘Access token’, and ‘Access Token Secret’.
-
You can also regenerate **Key, and Token **clicked on the **Regenerate **button.
Once Tweepy is installed, and the twitter client app is registered, let’s get the hands dirty:
Importing necessary libraries
We have to import all the required libraries. I hope that you are fully aware of the python necessary libraries required for data collection, data preprocessing work like Pandas, NumPy, Matplotlib.
import pandas as pd
import numpy as np
import matplotlib.pyplot as plt
import time
import tweepy
import re
As we imported all the required libraries, our next task is to create a sentiment analyzer object.
from vaderSentiment.vaderSentiment import SentimentIntensityAnalyzer
analyzer = SentimentIntensityAnalyzer()
From vaderSentiment, we import the necessary package **SentimentIntensityAnalyzer **created the object.
Getting Credentials
Now to extract the tweets from twitter, we need to fill the consumer_key, consumer_secret, access_key, and access_secret as I told you earlier how to create an app and obtain these credentials in Authentication.
consumer_key = "YOUR KEY HERE."
consumer_secret = "YOUR KEY HERE."
access_key = "YOUR KEY HERE."
access_secret = "YOUR KEY HERE."

def initialize():
    auth = tweepy.OAuthHandler(consumer_key, consumer_secret)
    auth.set_access_token(access_key, access_secret)
    api = tweepy.API(auth, parser = tweepy.parsers.JSONParser())
    return api

api = initialize()
After getting authorization, we are ready to pull out the tweets. But before that, we have to define the competitor searches. As I told you, this twitters sentimental analysis model is for the market research purpose, so we have to take the global organizations in the information technology field. Here for evaluation, I took five global organizations, namely as Google, IBM, Microsoft, Tesla, and Amazon. These organizations continuously update their followers about their latest products and services in the world. So this is the best way to analyze their tweets and gather some meaningful insights using VADER.
comp_searches = ("[@Google](http://twitter.com/Google)", "[@IBM](http://twitter.com/IBM)", "[@Microsoft](http://twitter.com/Microsoft)", "[@Tesla](http://twitter.com/Tesla)", "[@amazon](http://twitter.com/amazon)"))
Now, after defining organizations, we are ready to extract the tweets. From the below code, we are extracting 100 tweets from each organization twitter feed.
# Array to hold sentiment
sentiments = []

# Iterate through all the comp_searches
for search in comp_searches:

    # Bring out the 100 tweets
    comp_tweets = api.user_timeline(search, count=100)

    # Loop through the 100 tweets
    for tweet in comp_tweets:
        text = tweet["text"]

     # Add each value to the appropriate array
        sentiments.append({"User": search,
                           "text":text,
                       "Date": tweet["created_at"]
                        })
We stored all the tweets in sentiments dictionary along with User and date when the tweet get posted.
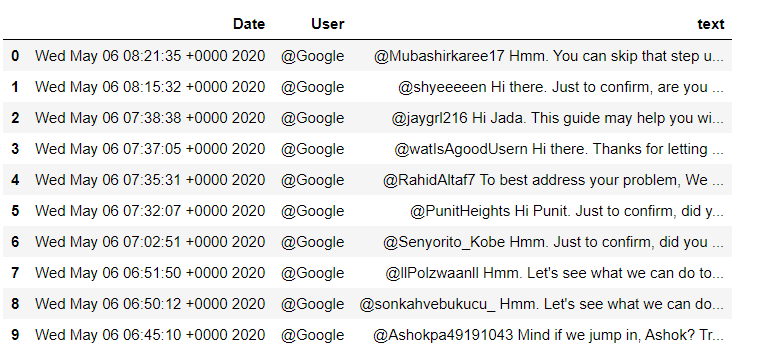
As the tweets data is in the dictionary, we convert it into a data frame for further processing. Now you can see the data pulled out from twitter with tweets, User along with post-date.
*#convert array to dataframe*
df = pd.DataFrame.from_dict(sentiments)
df.head(10)
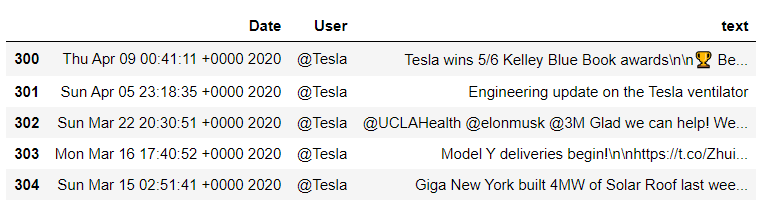
If you want to see the tweets from a specific user, you can write the above code and get it.
#to see tweets for specific User name
df_tesla = df[ df['User'] == '[@Tesla](http://twitter.com/Tesla)']
df_tesla.head()
Cleaning the twitter data
Well, we fetched real-time tweets from twitter, but now we have to extract meaningful insights from the tweet’s data. For that, we have to clean data because it contains lots of URLs, numbers, and user_ids, which get challenging to analyze tweets.
*#cleaning the tweets*

**def** remove_pattern(input_txt, pattern):
    r = re.findall(pattern, input_txt)
    **for** i **in** r:
        input_txt = re.sub(i, '', input_txt)
    **return** input_txt

**def** clean_tweets(tweets):
    *#remove twitter Return handles (RT @xxx:)*
    tweets = np.vectorize(remove_pattern)(tweets, "RT @[\w]*:")

    *#remove twitter handles (@xxx)*
    tweets = np.vectorize(remove_pattern)(tweets, "@[\w]*")

    *#remove URL links (httpxxx)*
    tweets = np.vectorize(remove_pattern)(tweets, "https?://[A-Za-z0-9./]*")

    *#remove special characters, numbers, punctuations (except for #)*
    tweets = np.core.defchararray.replace(tweets, "[^a-zA-Z]", " ")

    **return** tweets
Now calling the clean_tweets() function parameter as the df[‘text’] whole column.
df['text'] = clean_tweets(df['text'])
df['text'].head()
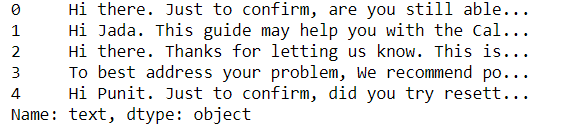
Finding scores for tweets
Now, using polarity_scores() we, will find all the positive, negative, and neutral scores for each tweet.
scores = []

*# Declare variables for scores*
compound_list = []
positive_list = []
negative_list = []
neutral_list = []

**for** i **in** range(df['text'].shape[0]):

*#print(analyser.polarity_scores(sentiments_pd['text'][i]))*
    compound = analyzer.polarity_scores(df['text'][i])["compound"]
    pos = analyzer.polarity_scores(df['text'][i])["pos"]
    neu = analyzer.polarity_scores(df['text'][i])["neu"]
    neg = analyzer.polarity_scores(df['text'][i])["neg"]

    scores.append({"Compound": compound,
                       "Positive": pos,
                       "Negative": neg,
                       "Neutral": neu
                  })
Converting the scores dictionary containing the scores into the data frame, then join the sentiments_score data frame with the df data frame.
sentiments_score = pd.DataFrame.from_dict(scores)
df = df.join(sentiments_score)
df.head()
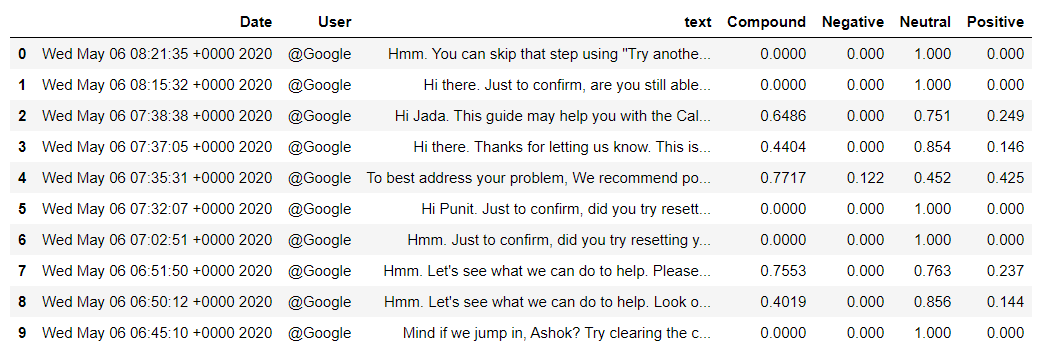
Now you can see the scores associated with the respective tweets and analyze where the tweet is positive, neutral, or negative.
Collecting Hashtags
Now we have to collect the positive hashtags from the tweets data. For that, we use functions developed by Prateek Joshi on this tutorial: Comprehensive Hands on Guide to Twitter Sentiment Analysis with dataset and code.
HT_positive = []
def hashtag_extract(x):
hashtags = []
# Loop over the words in the tweet
for i in x:
ht = re.findall(r"#(\w+)", i)
hashtags.append(ht)
return hashtags
# extracting hashtags from positive tweetsHT_positive = hashtag_extract(df_tws['text'][df_tws['sent'] == 1])
# extracting hashtags from tweets
HT_positive = hashtag_extract(df['text'][df['Compound'] > 0.5])
# unnesting list
HT_positive = sum(HT_positive,[])
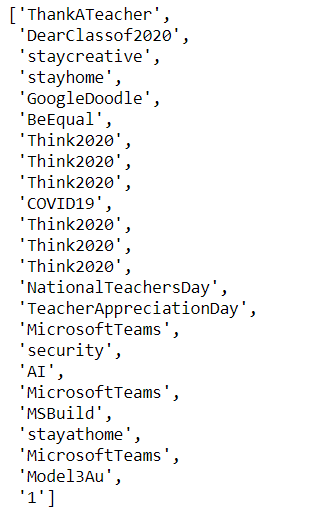
HT_positive
You can see the positive hashtags also,
Plotting Wordcloud
from wordcloud import WordCloud, STOPWORDS, ImageColorGenerator

def word_cloud(wd_list):
    stopwords = set(STOPWORDS)
    all_words = ' '.join([text for text in wd_list])
    wordcloud = WordCloud(
        background_color='white',
        stopwords=stopwords,
        width=1600,
        height=800,
        random_state=1,
        colormap='jet',
        max_words=80,
        max_font_size=200).generate(all_words)
    plt.figure(figsize=(12, 10))
    plt.axis('off')
    plt.imshow(wordcloud, interpolation="bilinear");

word_cloud(df['text'])
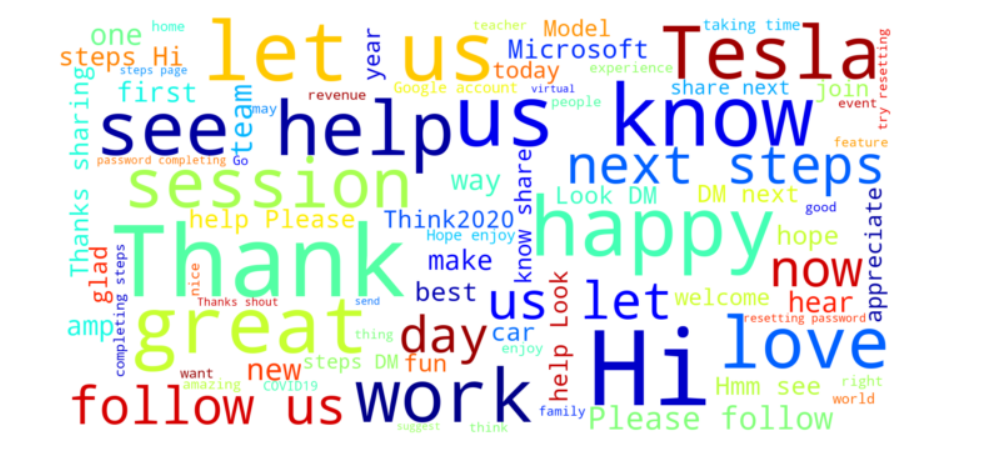
Wordcloud is used to display the keywords that are most actively present in your document or text dataset. Wordcloud is the informative visual representation of text datasets, highlighting the most popular and trending keywords in text datasets based on the frequency of occurrence and importance.
From above wordcloud Tesla, Thank, Hi, happy, help, see, **let **are the words that appear in most frequent time in the tweets dataset.
Pivot table design
We design a pivot table for evaluating the mean compound score of all the organization’s tweets, and you can see the result also.
*#Collect the compound values for each news source*
score_table = df.pivot_table(index='User',  values="Compound", aggfunc = np.mean)
score_table
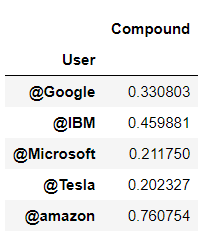
From this plot, you can visualize the overall sentiments of the latest 100 tweets from each organization. @amazon has the highest compound score among these five organizations so you can analyze that total tweets posted by this organization are mostly positive.
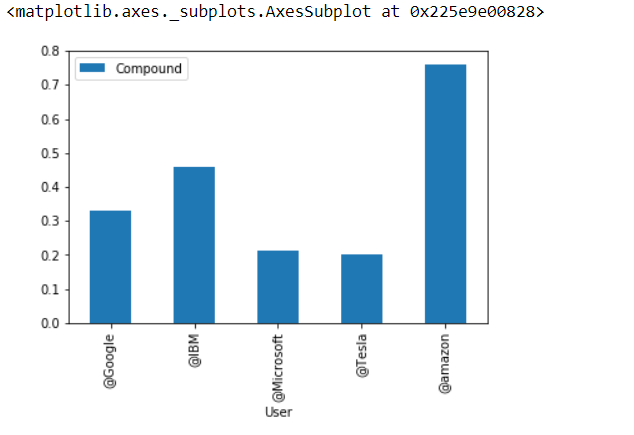
Polarity_score Visualization
Last but not least bar-plot is best for the overall sentiment analysis for us,
*#plotting
*score_table.plot(kind='bar')
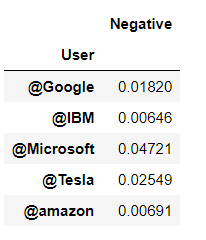
Now looking for the organization who posted a maximum number of negative tweets,
#Collect the negative values for each news source
neg_score_table = df.pivot_table(index='User',  values="Negative", aggfunc = np.mean)
neg_score_table
Now we see **Polarity_score Visualization **for the negative score pivot table,
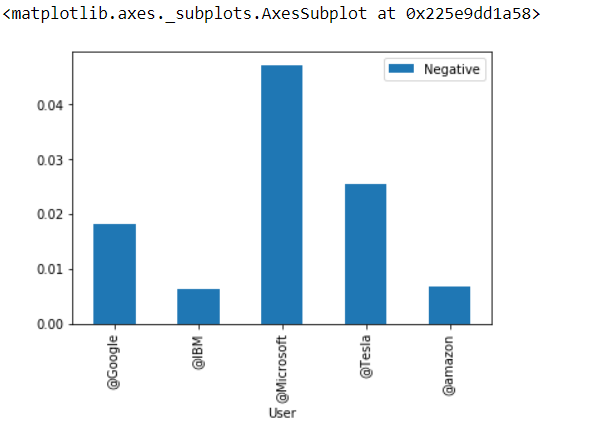
The barplot clears everything for us so the final observations are,
6. Observations
-
All organizations Google, IBM, Microsoft, Tesla, Amazon, posted tweets are predicted as positive.
-
Among the positive tweets, @amazon has the highest compound score, while @Tesla has the least positive score.
-
Considering negative tweets, @Microsoft posted the most number of negative tweets, and @IBM has a less negative score.
7. Conclusion
 Source:- pinterst.com
Using VADER sentiment analysis, the derived outcomes helps us to understand the opinions of the users and classify them in positive, negative, neutral category according to the formulated sentiment scores. For the social media type text data, performing sentimental analysis using VADER is quite an exciting task to accomplish.
To understand the emotions or opinions of the customers regarding any company’s product or services and to maintain the branding in the market, sentimental analysis is necessary.
That’s all folks.
See you in my next post.
Hello there 👋 I hope you are getting knowledge from my articles. If you would like to support me, feel free to buy me some coffee 🙏☕ > https://www.buymeacoffee.com/amey23 > or Contact me at, ameypband23@gmail.com > Happy to help you.
A complete Python notebook is available on my Github repository. Amey23/Twitter-Sentimental-Analysis *This is a twitter sentimental analysis model that performs Vader sentiment analysis along with tweepy on twitter data…*github.com
Comments
Loading comments…