New day, New Topic. Let’s learn along!😉

Congratulations on successfully setting up Grafana on your local environment!
Now, it’s time to creating a dashboard using Grafana with integration of Loki and Promtail
In this exciting task, we’ll explore how Grafana enables you to monitor and analyze various components of your server in real-time.
So, let’s dive in and make monitoring a breeze!

- What is Loki and Promtail..??
Loki and Promtail are two key components of a log monitoring stack that work together to provide efficient log aggregation and analysis. Here’s a summary of their usage and the difference between them:
- Loki: Loki is a horizontally scalable log aggregation system that stores and indexes log data for efficient querying and analysis. It acts as the central repository for log data and enables fast, distributed log processing.
- Promtail: Promtail is a lightweight log collector that runs on individual servers or containers and collects log data from various sources. It tails log files or streams and sends the data to Loki for storage and analysis.
Here is our Today’s Task-01 :
- Creating a dashboard using Grafana with integration of Loki and Promtail.
Install Loki and Promtail using Docker
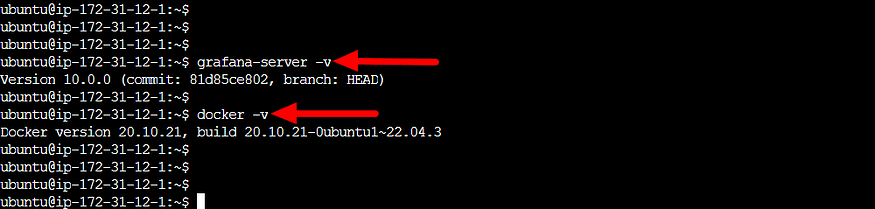
Install Grafana:
we have discussed in previously story how to install Grafana you can read here.
Install Docker:
Updates the package lists on the system, ensuring that the latest package information is available for installation.
sudo apt-get update
sudo apt install docker.io
sudo usermod -aG docker $USER
sudo reboot
sudo apt install docker.io: Installs the Docker package on Ubuntu, enabling the use of Docker containers to deploy and manage applications.sudo usermod -aG docker $USER: Grants the current user permission to run Docker commands by adding them to thedockergroup. This allows the user to execute Docker commands without usingsudofor elevated privileges.
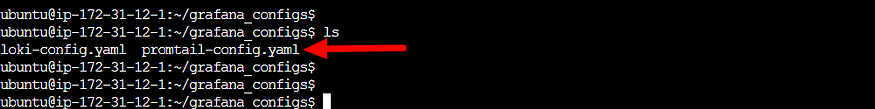
Download Loki Config:
Use the following command to download the Loki configuration file:
mkdir grafana_configs
cd grafana_configs
wget
https://raw.githubusercontent.com/grafana/loki/v2.8.0/cmd/loki/loki-local-config.yaml -O loki-config.yaml
- This command uses
wgetto download the Loki configuration file from the specified URL. - The configuration file contains settings for Loki, such as storage configurations, retention policies, and remote storage options.
Download Promtail Config
Download the Promtail configuration file using the command below in grafana_configs directory:
wget
https://raw.githubusercontent.com/grafana/loki/v2.8.0/clients/cmd/promtail/promtail-docker-config.yaml -O promtail-config.yaml
- The configuration file contains settings for Promtail, such as log file paths, labels, and target Loki endpoints.
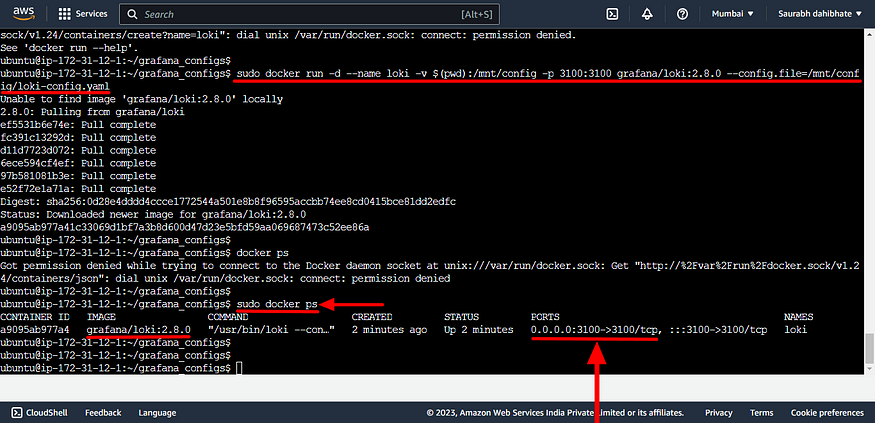
Run Loki Docker container:
Execute the following command to run the Loki Docker container, providing the downloaded configuration file:
sudo docker run -d
--name loki -v $(pwd):/mnt/config -p 3100:3100
grafana/loki:2.8.0 --config.file=/mnt/config/loki-config.yaml
- This command starts a Docker container named “loki” using the
grafana/loki:2.8.0image. - The
-dflag runs the container in detached mode. - The
-vflag mounts the current directory ($(pwd)) as a volume inside the container, allowing the Loki configuration file to be accessed. - The
-pflag maps port 3100 of the container to the host, enabling access to Loki's HTTP endpoint.
- Edit inbound rule in security group of ec2 instance allow port 3100.
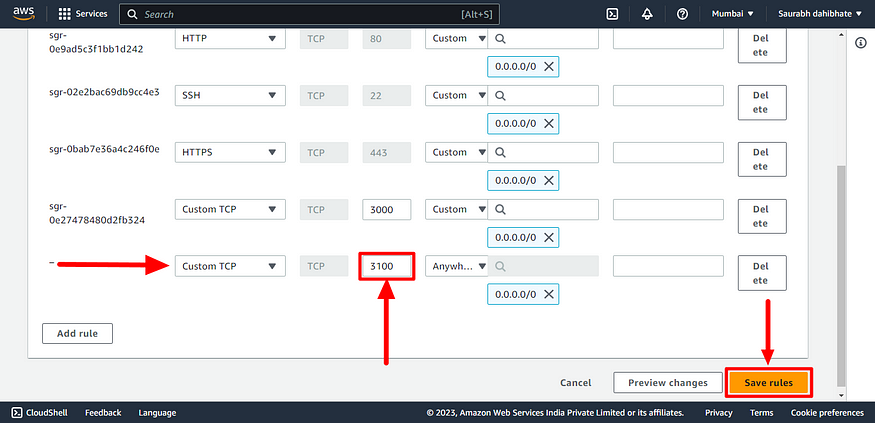
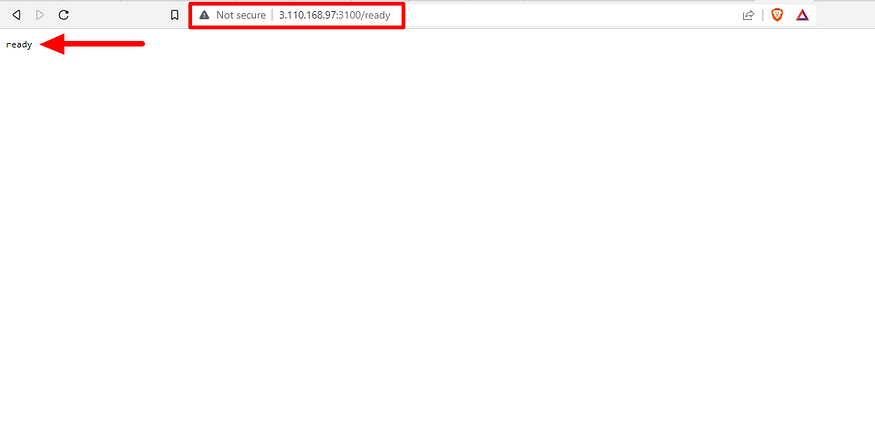
- Copy public-ip of instance and paste in browser on https:
:3100/ready and check loki is ready..?
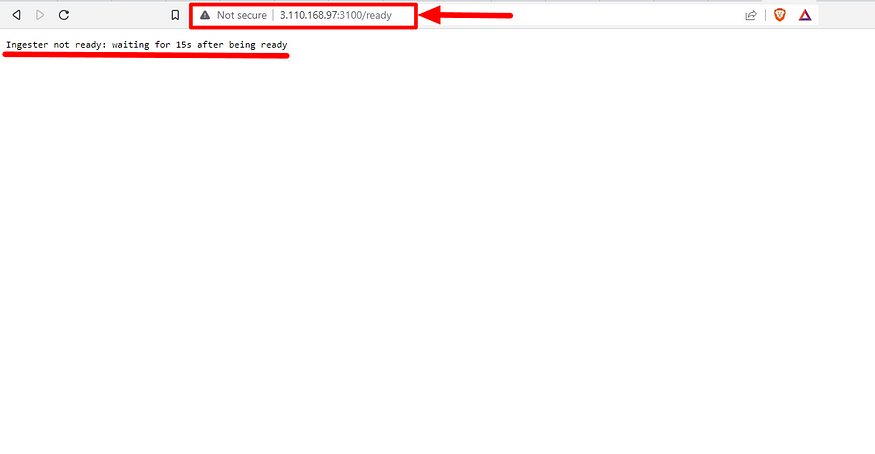
- Yes Loki is Ready
- In Loki what kind of logs or metrics are there we can get those like this use `/metrics``

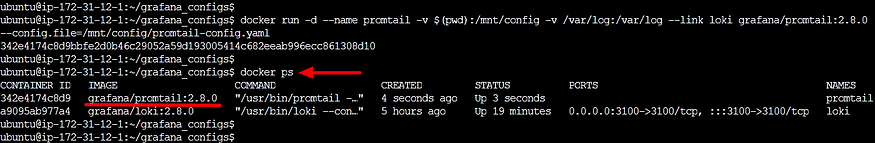
Run Promtail Docker container:
Run the Promtail Docker container with the downloaded configuration file, mounting the host’s log directory:
sudo docker run -d --name promtail -v $(pwd):/mnt/config -v /var/log:/var/log
--link loki grafana/promtail:2.8.0
--config.file=/mnt/config/promtail-config.yaml
- This command starts a Docker container named “promtail” using the
grafana/promtail:2.8.0image. - The
-dflag runs the container in detached mode. - The
-vflag mounts the current directory ($(pwd)) as a volume inside the container, allowing access to the Promtail configuration file. - The second
-vflag mounts the host's/var/logdirectory to the container's/var/logdirectory, enabling Promtail to collect logs from the host. - The
--link lokiflag establishes a network link between the Loki container and the Promtail container. - The
--config.fileflag specifies the location of the Promtail configuration file.
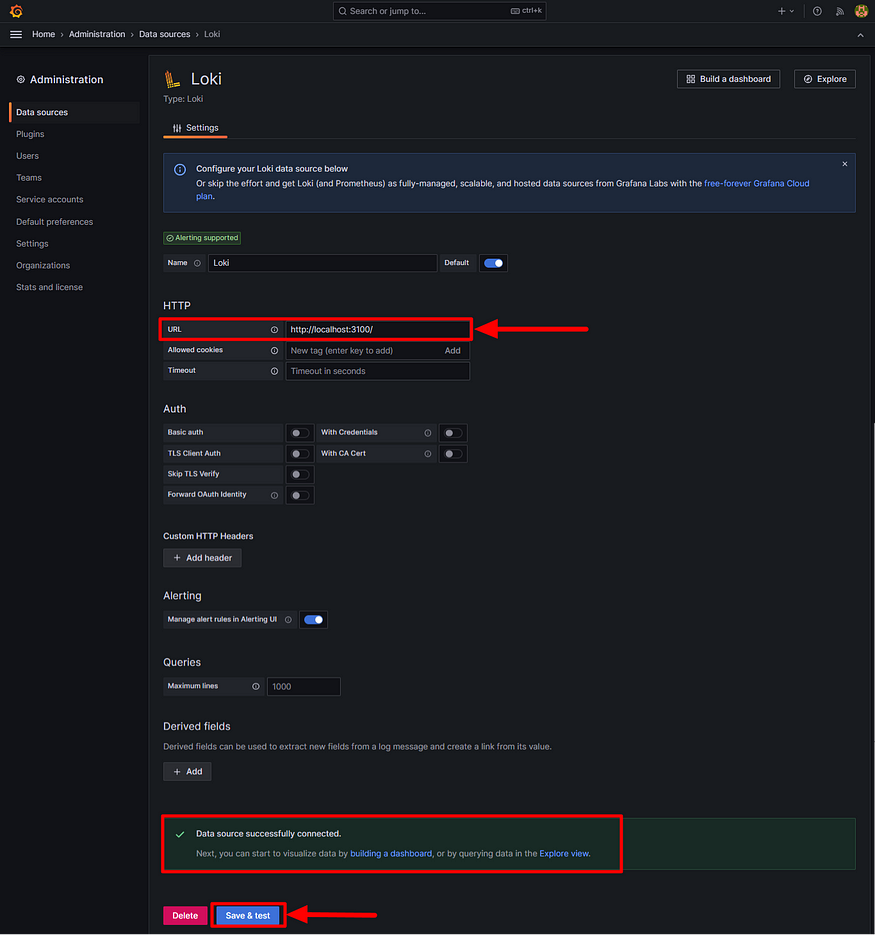
- Add Data source in Grafana
- Now, navigate to the Grafana webapp and on the homepage choose the add data source option.
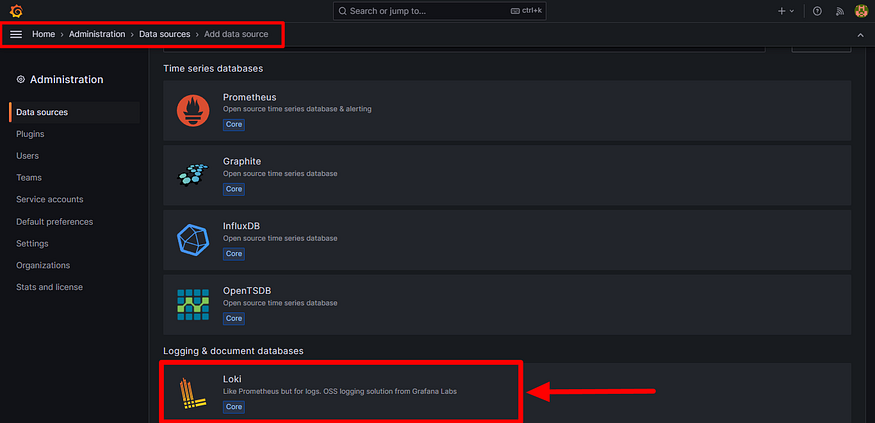
- Provide the HTTP URL as below to connect the loki data source to Grafana so that loki will send the logs to grafana.
- localhost:3100
- Click on save & test to connect the data source.
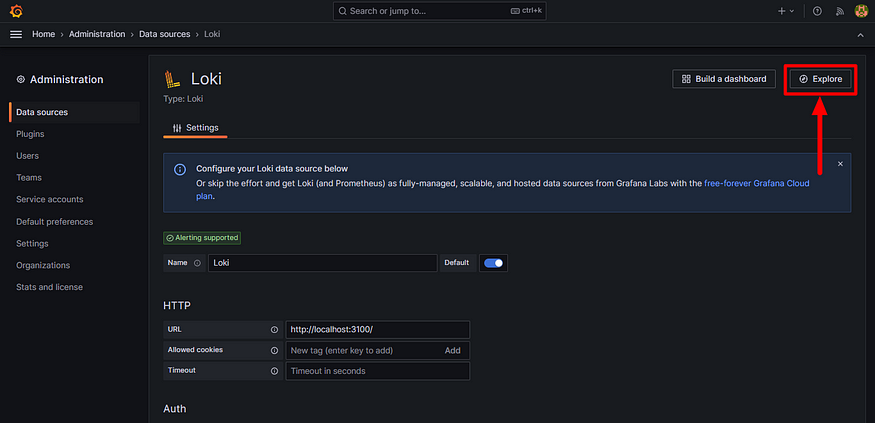
- Checking logs in Loki:
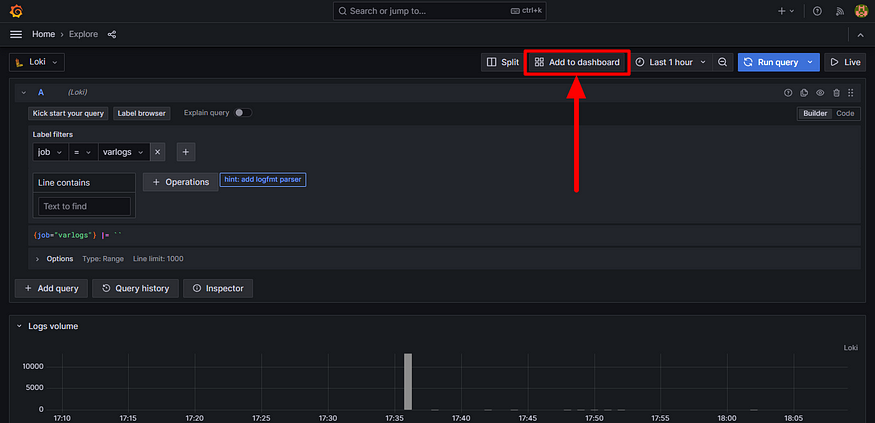
- Click on explore in the below screenshot after adding the data source.
- In the label filters, we can choose job and varlogs which is generally the path /var/log/*log in the backend to show all the system logs.
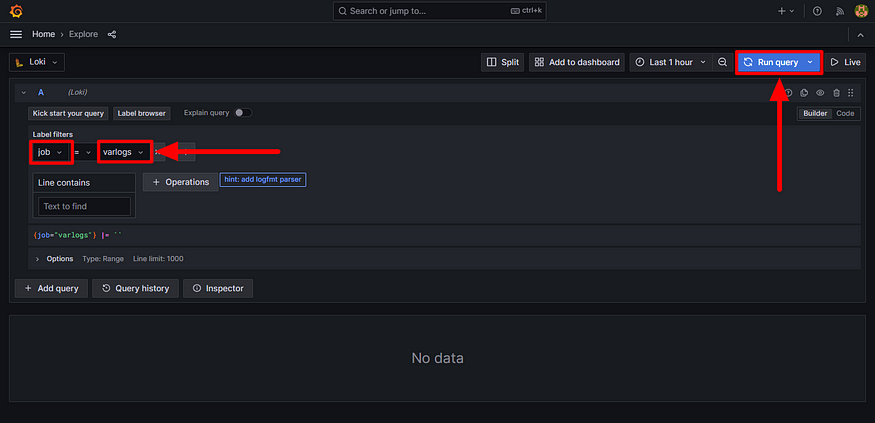
- Click on the run query in the above screenshot to execute and show all the system logs as below.
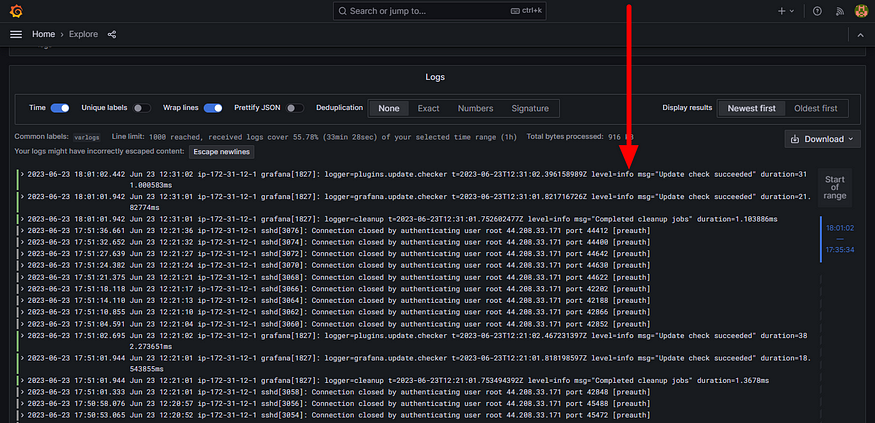
- Now we have to Create Dashboard:
- Let’s add the log to the dashboard by choosing the option from the above screenshot location.
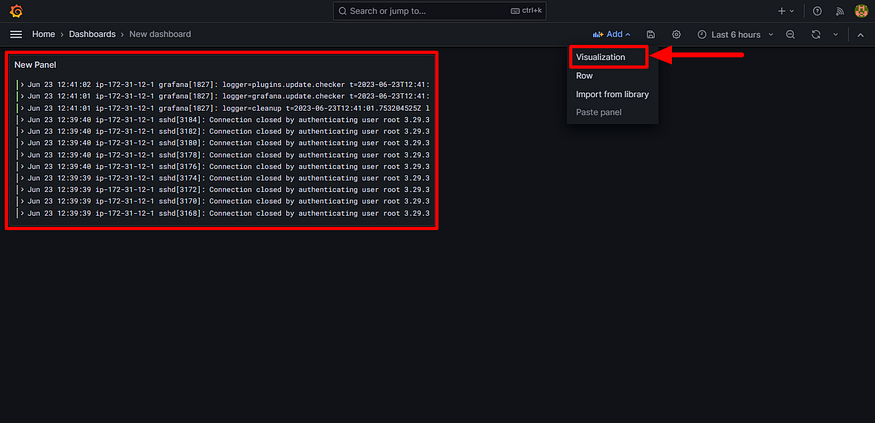
- Now the system logs are added to the grafana dashboard.
- Let’s add some more by clicking on visualization to add some graphs as shown below screenshot.
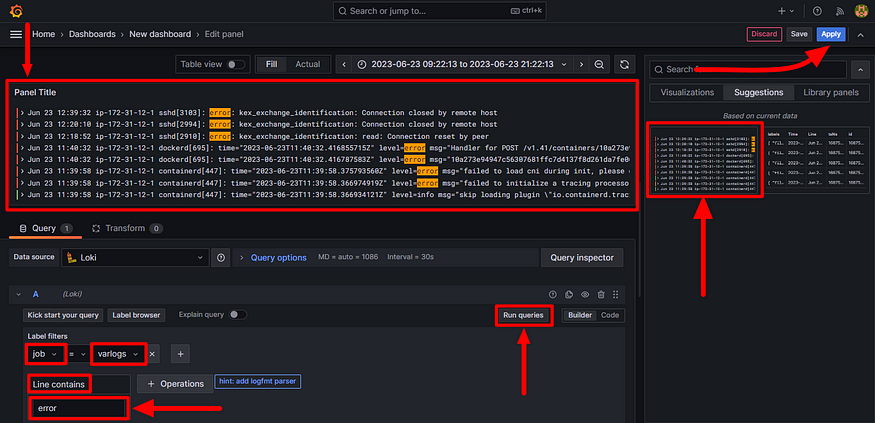
- In Label filters choose job and varlogs and line contains to error to show all the lines Run Query.
- On right hand side choose Logs > Click to change vizualization > select row format as shown in below.
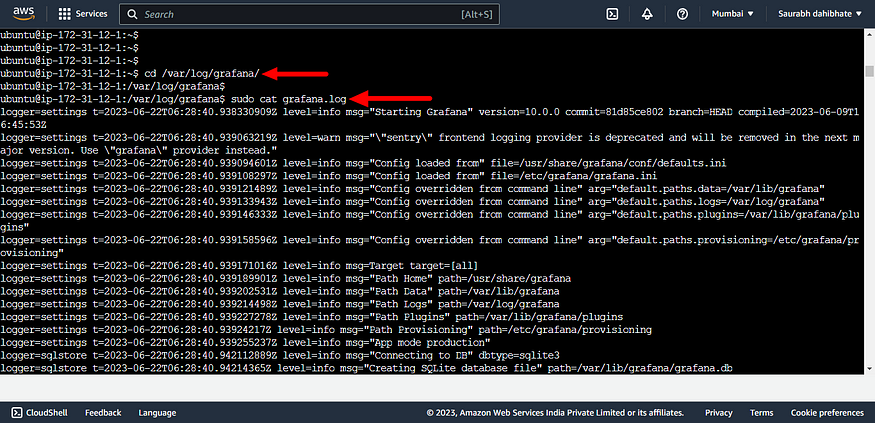
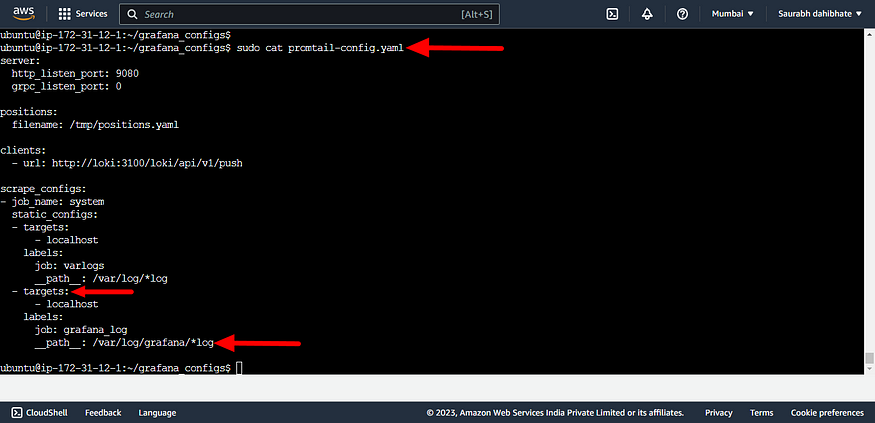
- Similarly, let’s check the error lines in grafana log that is placed in /var/log/grafana/grafana.log
- To accomplish the objective of displaying the Grafana log, we must specify the Grafana log path in the promtail config YAML file within the target section, as illustrated below.
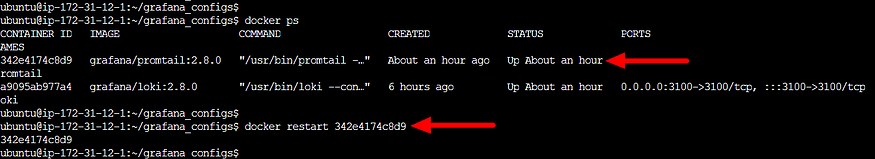
- After edit promtail_config.yaml file we have to restart our promtail docker container
- We can now choose the label filters to set the job and grafana logs with the line contains and visualization option to view in a graphical manner. We can add this to our dashboard.
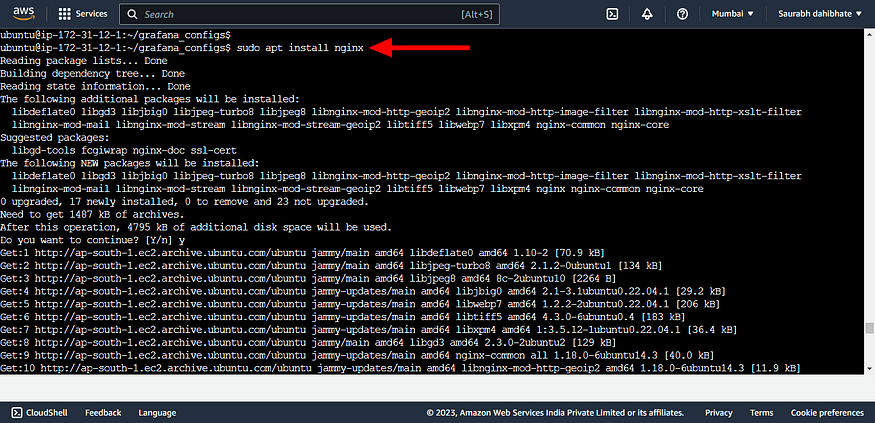
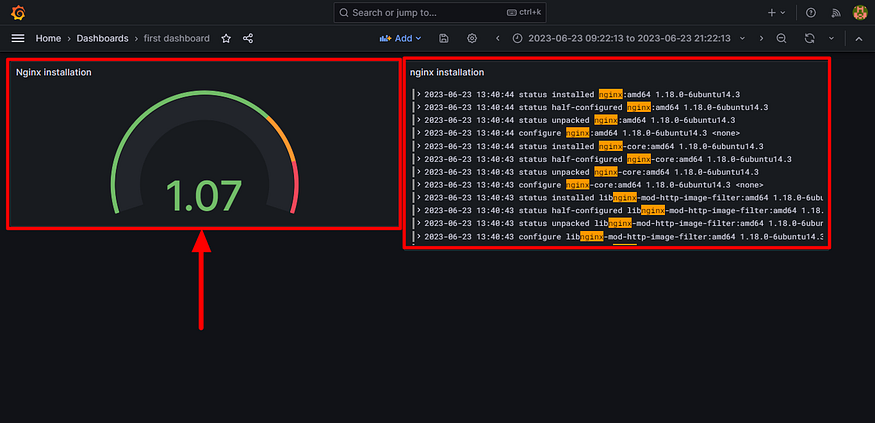
- Use the proper label filters to show an aggregate sum of words repeating nginx while installing. This can be achieved by setting the varlogs as label filters.
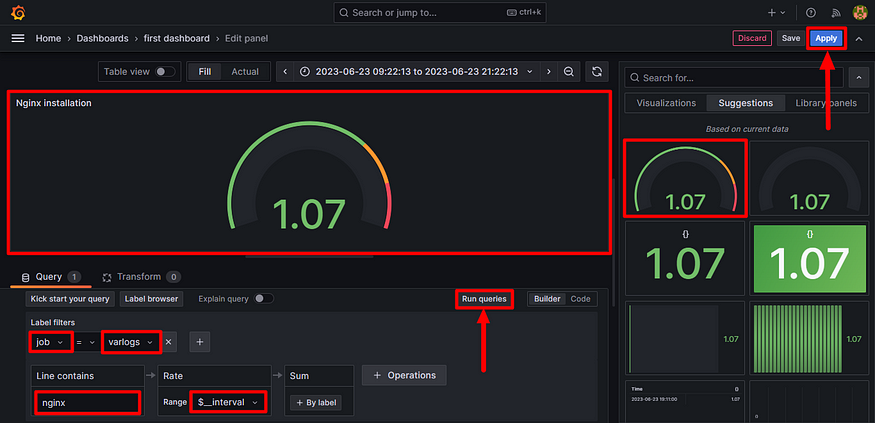
- We can see now the complete grafana dashboard.
🔶That’s all about today’s task of DevOps journey
🔸Thankyou for reading 👍.
— — — — — — — — #keepLearning_DevOpsCloud ♾️☁️ — — — — — —

Comments
Loading comments…