
Logs are very important because they allow developers to monitor applications, which allows them to mitigate potential problems and provides vital information to troubleshoot them too. NGINX stores information and data collected, like website traffic, issues, request types, and many more, in log files. By default, NGINX has two logs: the error log and the access log. Where can I find these logs? This depends on the type of Linux distribution, but for most distributions, the two types of logs can be found in ''var/ngnix/logs''.
What Is NGINX Error Log?
When there are syntax errors in the configuration, connection issues, or if the NGINX server has start and shutdown issues, they are stored in the error logs. So anytime you are having any issues with your NGINX server, check your error logs for more details to troubleshoot the issues. Error logs usually also contain warnings that point to a few potential issues. An error log may look like the one below. This particular log entry corresponds to a 404 Not Found error, where the requested file (/contents-file.html) could not be located on the server.

What is the NGINX Access Log?
In contrast to error logs, client requests and server responses are recorded in the access logs. Information like user agents, IP addresses, and times of requests can be found in the access logs. The access log is useful for monitoring server activity and analyzing traffic patterns.
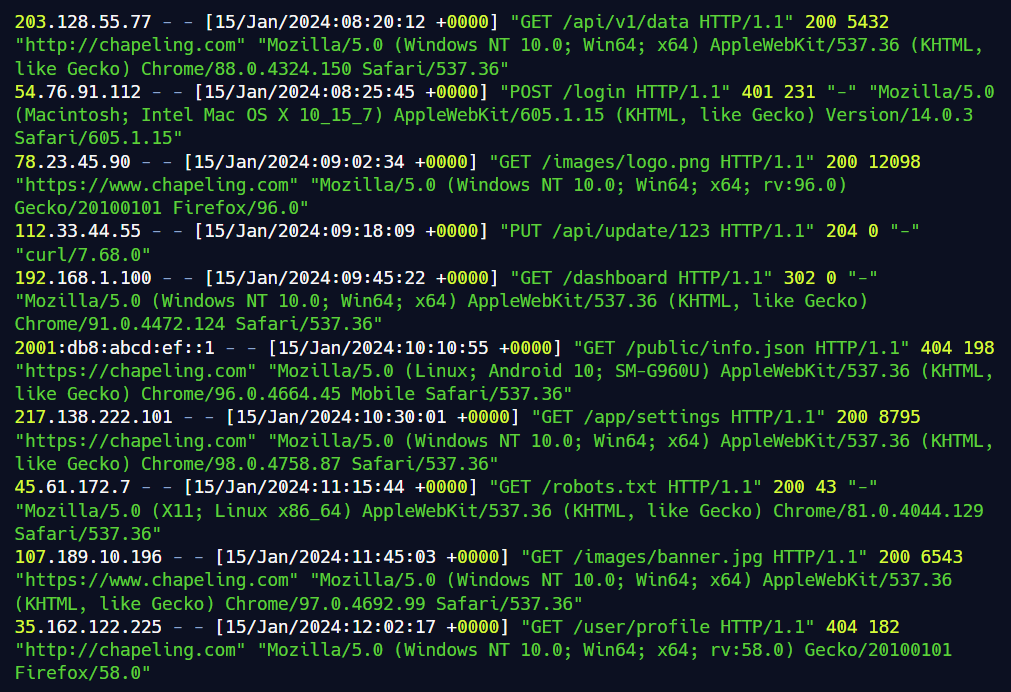
An access log may look like the one below. This log entry includes the client''s IP address, the timestamp, the HTTP request details, the HTTP status code, the number of bytes sent, the referrer URL, and the user agent.

Viewing the Log Files
In the NGINX logs, you can use the tail command to print the last 10 lines of the log file as follows:
$ sudo tail -f /var/log/nginx/access.log
Check if the output looks like the one below:
To view the full contents of a log file, use a text editor like nano:
$ nano /var/log/nginx/error.log
Enabling the Access Logs
By default, NGINX Access Logs should be enabled, but if that is not the case, you can use the access_log directive in the configuration file to enable it.
Open the /etc/nginx/nginx.conf file and add the following code block:
http {
	access_log /var/log/nginx/access.log;
}
It is also good practice to separate the access logs of virtual hosts into different files. To do this, replace the access_log directive specified in the http section with a different access_log directive within the server context.
http {
      access_log  /var/log/nginx/access.log;

         server {
                  listen 80;
                  server_name domain1.com
                  access_log  /var/log/nginx/domain1.access.log;
                }
}
Then restart the nginx service to apply the changes made to the configuration file.
$ sudo systemctl restart nginx
Disabling the Access Logs
To disable the NGINX access log, use the off value:
access_log off
The disable the access logs for virtual hosts.
http {
    access_log  /var/log/nginx/access.log;

    server {
        listen 80;
        server_name domain1.com;
        access_log off;  # Disable access logs for this specific server block
    }
}
Restart the nginx service to apply the changes made to the configuration file.
$ sudo systemctl restart nginx
Formatting Access Logs as JSON
You can also configure NGINX to format access logs as JSON. To customize NGINX access logs as JSON, simply set the log_format directive with the escape+json parameter.
http {
    log_format json_combined escape=json
        ''{"time_local":"$time_local",''
        ''"remote_addr":"$remote_addr",''
        ''"request":"$request",''
        ''"status": "$status",''
        ''"body_bytes_sent":"$body_bytes_sent",''
        ''"http_referer":"$http_referer",''
        ''"http_user_agent":"$http_user_agent"}'';

    access_log /var/log/nginx/access.log json_combined;
}
Restart the nginx service to apply the changes made to the configuration file.
$ sudo systemctl restart nginx
You should now get outputs like the following:
{
  "time_local": "14/Feb/2022:11:25:44 +0000",
  "remote_addr": "217.138.222.109",
  "remote_user": "",
  "request": "GET /icons/ubuntu-logo.png HTTP/1.1",
  "status": "404",
  "body_bytes_sent": "197",
  "request_time": "0.000",
  "http_referrer": "http://192.168.100.1/",
  "http_user_agent": "Mozilla/5.0 (Windows NT 10.0; Win64; x64) AppleWebKit/537.36 (KHTML, like Gecko) Chrome/98.0.4758.87 Safari/537.36"
}
Enabling the Error Logs
By default, NGINX Error Logs should be enabled, but if that is not the case, you can use the error_log directive in the configuration file to enable it.
Open the /etc/nginx/nginx.conf file and add the following block:
http {
	error_log /var/log/nginx/error.log;
}
In NGINX, the error_log directive supports various levels of severity, ranging from lowest to highest. Here are the possible levels of severity, listed in increasing order of severity, along with their meanings:
''debug'': Detailed debugging information, typically used for troubleshooting and development. It generates a high volume of logs and is not recommended for production environments.
info: general informational messages about normal operations. This level is useful for keeping track of routine activities and operations.
notice: more important events than "info," but not errors. These messages highlight noteworthy occurrences that may be of interest for monitoring and analysis.
warn: Indicates potential issues or situations that could lead to problems if not addressed. It''s a step above "notice" and serves as a warning.
error: Indicates errors in the operation of the server that should be investigated. This level is crucial for identifying and resolving issues affecting the server''s functionality.
crit: critical conditions that require immediate attention. These are severe errors that may impact the overall stability and functionality of the server.
alert: Indicates situations that require immediate action. This level is used for alerts that need prompt attention to prevent further issues.
emerg: The highest level of severity, indicating a system-wide emergency. This level is reserved for the most critical situations, where immediate action is necessary to prevent a complete system failure.
When configuring the error_log directive in NGINX, you can specify the desired severity level. For example:
error_log /var/log/nginx/error.log warn;
This configuration will log warning messages and all higher severity messages (error, crit, alert, emerg) to the specified error log file. Adjust the severity level based on your monitoring and troubleshooting needs.
In NGINX, you can log errors into multiple files by configuring multiple error_log directives with different log file paths and optional severity levels. This allows you to segregate and manage different types of errors in distinct log files for better analysis and troubleshooting. Here''s how you can set up logging errors in multiple files in NGINX:
http {
    # Main error log
    error_log /var/log/nginx/error.log warn;

    # Additional error log with a specific severity level
    error_log /var/log/nginx/critical_errors.log crit;

    # Another additional error log with debug level
    error_log /var/log/nginx/debug_errors.log debug;
}
For the configuration above:
- The first
error_logdirective logs warnings and higher severity errors to/var/log/nginx/error.log. - The second
error_logdirective logs only critical errors to/var/log/nginx/critical_errors.log. - The third
error_logdirective logs debug-level errors to/var/log/nginx/debug_errors.log.
Restart the nginx service to apply the changes made to the configuration file.
$ sudo systemctl restart nginx
Disabling the error log
In NGINX, you can disable the error log by setting error_log to offor /dev/null:
error_log off;
error_log /dev/null;
Creating Custom Log format
You can create custom log formats to override the default functions of the default log formats.
For the access log, use the log_format directive to customize the format of the entries in the server or the location blocks.
log_format custom ''$remote_addr - $remote_user [$time_local] '' ''"$request" $status $body_bytes_sent '' ''"$http_referer" "$http_user_agent"'';
Here is what each variable in the log_format mean:
$remote_user: information about the user making the request
$request: actual request details like path, method, and protocol.
$remote_addr: the IP address of the client
$status: the response code.
$time_local: the server''s date and time.
$body_bytes_sent: the size of the response in bytes.
$http_user_agent: detailed user agent information.
$http_referer: the IP address of the HTTP referrer.
Check out other variables you can use in your custom log format.
Output:

To configure the access log format, set a nickname as the identifier and specify the string representing the details for the log messages.
log_format <nickname> ''<formatting_variables>'';
Create a second parameter to apply to the log file:
access_log /var/log/nginx/access.log custom;
Conclusion
In this article you learnt how to locate, view, and customize the access and error logs, as well as how to use a structured format like JSON for easier analysis.
Nginx access and error logs are very important to system administrators, offering critical insights into a server''s performance and helping them troubleshoot issues efficiently. The access log records details of every HTTP request, allowing administrators to understand user behavior, optimize website performance, and detect potential security threats.
While error logs provide a comprehensive record of server malfunctions, errors, and issues. Important part of error logs offer useful information about the nature and impact of errors, facilitating prompt identification and resolution of issues that may affect server functionality.
Overall logging is a vital tool for monitoring, troubleshooting, and optimizing your web server performance.
Comments
Loading comments…