Provided are snippets of Python code showcasing various data analysis tasks using popular libraries such as NumPy, Pandas, Matplotlib, Seaborn, SciPy, Scikit-learn, Statsmodels, Dask, Bokeh, NLTK, Beautiful Soup, Plotly, Altair, Vaex, Geopandas, Folium, Xarray, LightGBM, Keras, Arrow, NetworkX, Pygame, Dash, and PyCaret.
The examples cover tasks like creating arrays, DataFrames, and visualizations, performing statistical tests, implementing machine learning models, parsing HTML content, and working with geographical data.
Each code snippet offers a concise illustration of the libraries’ capabilities, serving as a practical reference for users engaged in data analysis using Python.
1. Numpy
NumPy is a powerful numerical computing library in Python, providing support for large, multi-dimensional arrays and matrices, along with mathematical functions to operate on these data structures.
Code example:
import numpy as np

# Creating a NumPy array
arr = np.array([1, 2, 3, 4, 5])

# Calculating mean and standard deviation
mean_value = np.mean(arr)
std_dev = np.std(arr)

print(f"Mean: {mean_value}, Standard Deviation: {std_dev}")
Screenshot:
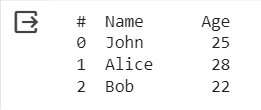
 2. Pandas
Pandas is a data manipulation and analysis library for Python, offering data structures like DataFrame for efficient data handling, cleaning, and exploration.
Code example:
import pandas as pd

# Creating a Pandas DataFrame
data = {''Name'': [''John'', ''Alice'', ''Bob''],
        ''Age'': [25, 28, 22]}
df = pd.DataFrame(data)

# Displaying the DataFrame
print(df)
Screenshot:
 3. Matplotlib
Matplotlib is a versatile 2D plotting library in Python, widely used for creating static, interactive, and animated visualizations.
Code example:
import matplotlib.pyplot as plt

# Creating a simple line plot
x = [1, 2, 3, 4, 5]
y = [2, 4, 6, 8, 10]

plt.plot(x, y)
plt.xlabel(''X-axis'')
plt.ylabel(''Y-axis'')
plt.title(''Simple Line Plot'')
plt.show()
Screenshot:
 4. Seaborn
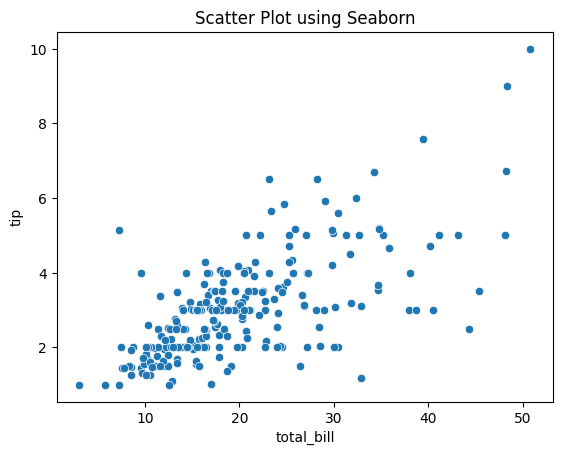
Seaborn is a statistical data visualization library based on Matplotlib, designed for aesthetically pleasing and informative statistical graphics.
Code example:
import seaborn as sns

# Using Seaborn to create a scatter plot
tips = sns.load_dataset(''tips'')
sns.scatterplot(x=''total_bill'', y=''tip'', data=tips)
plt.title(''Scatter Plot using Seaborn'')
plt.show()
Screenshot:
 5. SciPy
SciPy is an open-source library for mathematics, science, and engineering, extending NumPy by providing additional functionality for optimization, integration, interpolation, and more.
Code example:
import scipy.stats

# Performing a t-test
data1 = [1, 2, 3, 4, 5]
data2 = [2, 4, 6, 8, 10]

t_stat, p_value = scipy.stats.ttest_ind(data1, data2)
print(f"T-statistic: {t_stat}, p-value: {p_value}")
Screenshot:
 6. Scikit-learn
Scikit-learn is a machine learning library in Python, featuring simple and efficient tools for data analysis and modeling, including various algorithms for classification, regression, clustering, and dimensionality reduction.
Code example:
from sklearn.datasets import load_iris
from sklearn.model_selection import train_test_split
from sklearn.linear_model import LogisticRegression
from sklearn.metrics import accuracy_score
from sklearn.preprocessing import StandardScaler

# Load iris dataset as an example
iris = load_iris()
X = iris.data
y = iris.target

# Split the data into training and testing sets
X_train, X_test, y_train, y_test = train_test_split(X, y, test_size=0.2, random_state=42)

# Standardize the features using StandardScaler
scaler = StandardScaler()
X_train_scaled = scaler.fit_transform(X_train)
X_test_scaled = scaler.transform(X_test)

# Create and train a Logistic Regression model
model = LogisticRegression(max_iter=1000)
model.fit(X_train_scaled, y_train)

# Make predictions on the test set
predictions = model.predict(X_test_scaled)

# Calculate accuracy
accuracy = accuracy_score(y_test, predictions)

print(f"Accuracy: {accuracy}")
Screenshot:
 7. Statsmodels
Statsmodels is a library for estimating and testing statistical models in Python, offering a comprehensive range of statistical models and hypothesis tests.
Code example:
import statsmodels.api as sm

# Performing linear regression
x = [1, 2, 3, 4, 5]
y = [2, 4, 5, 4, 5]

x = sm.add_constant(x)
model = sm.OLS(y, x).fit()

# Displaying regression summary
print(model.summary())
Screenshot:
 8. Dask
Dask is a parallel computing library in Python, enabling the handling of larger-than-memory computations using parallel processing and task scheduling.
Code example:
import dask.dataframe as dd

# Creating a Dask DataFrame
data = {''Name'': [''John'', ''Alice'', ''Bob''],
        ''Age'': [25, 28, 22]}
df = dd.from_pandas(pd.DataFrame(data), npartitions=2)

# Performing a simple computation
result = df[''Age''].mean().compute()
print(f"Mean Age: {result}")
Screenshot:
 9. Bokeh
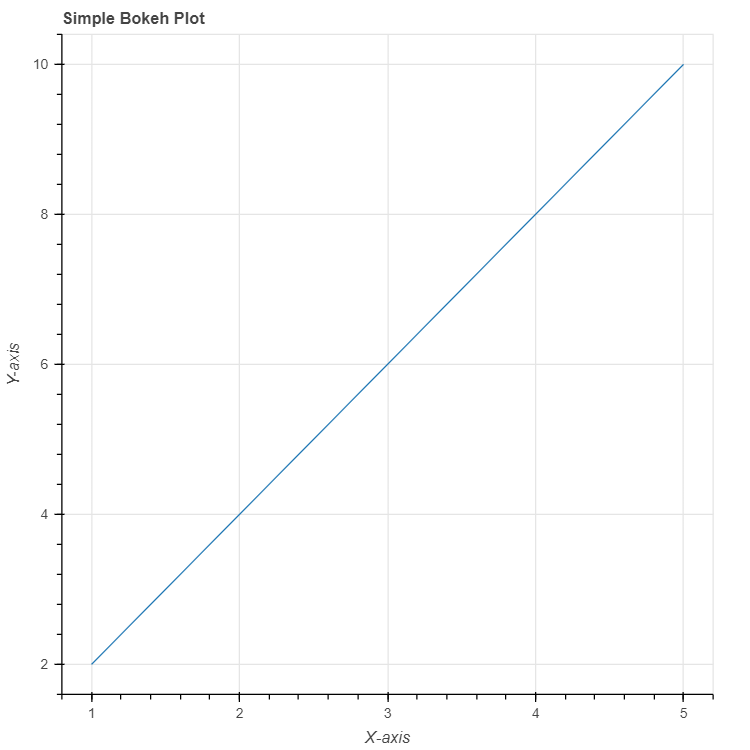
Bokeh is a Python interactive visualization library that targets modern web browsers for presentation, providing elegant and interactive visualizations for data exploration.
Code example:
from bokeh.plotting import figure, show
from bokeh.io import output_notebook

# Creating a simple Bokeh plot
output_notebook()

x = [1, 2, 3, 4, 5]
y = [2, 4, 6, 8, 10]

p = figure(title="Simple Bokeh Plot", x_axis_label=''X-axis'', y_axis_label=''Y-axis'')
p.line(x, y)

show(p)
Screenshot:
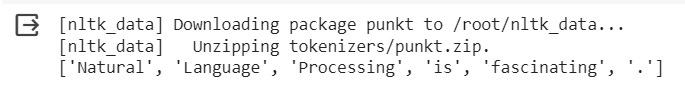
10. NLTK
NLTK (Natural Language Toolkit) is a powerful library for working with human language data, offering tools for tasks like tokenization, stemming, tagging, parsing, and more.
Code example:
import nltk
from nltk.tokenize import word_tokenize

nltk.download(''punkt'')

# Tokenizing a sentence
sentence = "Natural Language Processing is fascinating."
tokens = word_tokenize(sentence)

print(tokens)
Screenshot:
 11. Beautiful Soup
Beautiful Soup is a Python library for pulling data out of HTML and XML files, providing a convenient way to scrape web data.
Code example:
from bs4 import BeautifulSoup

# Parsing HTML content
html_content = "<html><body><p>This is a paragraph.</p></body></html>"
soup = BeautifulSoup(html_content, ''html.parser'')

# Extracting text from the paragraph tag
paragraph_text = soup.find(''p'').text
print(paragraph_text)
Screenshot:
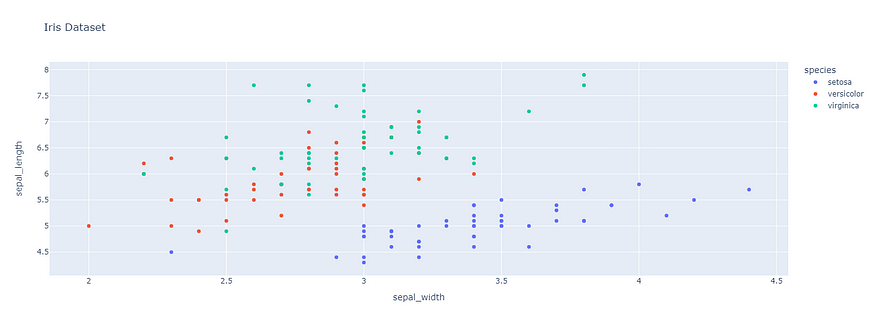
 12. Plotly
Plotly is a Python graphing library for interactive visualizations, suitable for creating interactive plots and dashboards.
Code example:
import plotly.express as px

# Creating a Plotly scatter plot
df = px.data.iris()
fig = px.scatter(df, x="sepal_width", y="sepal_length", color="species", title="Iris Dataset")
fig.show()
Screenshot:
 13. Altair
Altair is a declarative statistical visualization library in Python, allowing users to create a wide range of interactive visualizations with concise and intuitive syntax.
Code example:
pip install altair_viewerimport altair as alt
import pandas as pd

# Creating a simple Altair chart
data = pd.DataFrame({''x'': [1, 2, 3, 4, 5], ''y'': [2, 4, 6, 8, 10]})
chart = alt.Chart(data).mark_point().encode(x=''x'', y=''y'').properties(title=''Altair Chart'')

chart
Screenshot:
 14. Vaex
Vaex is a Python library for lazy, out-of-core DataFrames, enabling efficient handling of large datasets without loading them entirely into memory.
Code example:
pip install vaeximport vaex

# Creating a Vaex DataFrame
data = {''Name'': [''John'', ''Alice'', ''Bob''],
        ''Age'': [25, 28, 22]}
df = vaex.from_dict(data)

# Displaying the Vaex DataFrame
print(df)
Screenshot:
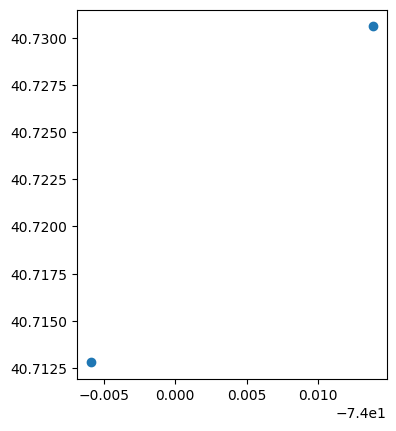
 15. Geopandas
Geopandas is an extension of Pandas, tailored for working with geospatial data, allowing for efficient manipulation and analysis of geographical datasets.
Code example:
import geopandas as gpd
from shapely.geometry import Point

# Creating a GeoDataFrame with points
geometry = [Point(-74.0059, 40.7128), Point(-73.9862, 40.7306)]
gdf = gpd.GeoDataFrame(geometry=geometry, crs="EPSG:4326")

# Plotting the GeoDataFrame
gdf.plot()
plt.show()
Screenshot:
 16. Folium
Folium is a Python library that simplifies the creation of interactive leaflet maps, making it easy to visualize geospatial data on interactive maps.
Code example:
import folium

# Creating a Folium map
map = folium.Map(location=[37.7749, -122.4194], zoom_start=10)

# Adding a marker
folium.Marker(location=[37.7749, -122.4194], popup=''San Francisco'').add_to(map)

# Displaying the map
map
Screenshot:

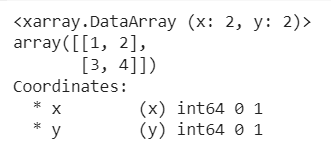
17. Xarray
Xarray is a Python library for working with labeled multi-dimensional arrays, offering a powerful and flexible data structure for handling complex datasets.
Code example:
import xarray as xr

# Creating a simple xarray dataset
data = xr.DataArray([[1, 2], [3, 4]], dims=(''x'', ''y''), coords={''x'': [0, 1], ''y'': [0, 1]})

# Displaying the xarray dataset
print(data)
Screenshot:
 18. LightGBM
LightGBM is a gradient boosting framework in Python, optimized for large datasets and capable of training extremely fast and accurate models.
Code example:
import lightgbm as lgb
from sklearn.datasets import load_iris
from sklearn.model_selection import train_test_split
from sklearn.metrics import accuracy_score

# Loading Iris dataset and splitting it
iris = load_iris()
X_train, X_test, y_train, y_test = train_test_split(iris.data, iris.target, test_size=0.2)

# Training a LightGBM classifier
model = lgb.LGBMClassifier()
model.fit(X_train, y_train)

# Making predictions and calculating accuracy
predictions = model.predict(X_test)
accuracy = accuracy_score(y_test, predictions)

print(f"Accuracy: {accuracy}")
Screenshot: Refer Google Colab Notebook for more
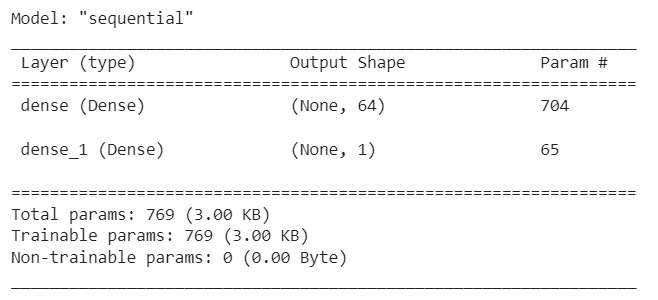
 19. Keras
Keras is a high-level neural networks API in Python, facilitating the development and experimentation of deep learning models with user-friendly interfaces.
Code example:
from tensorflow.keras.models import Sequential
from tensorflow.keras.layers import Dense

# Creating a simple Keras model
model = Sequential()
model.add(Dense(units=64, activation=''relu'', input_dim=10))
model.add(Dense(units=1, activation=''sigmoid''))

# Displaying the model summary
model.summary()
Screenshot:
 20. Arrow
Arrow is a Python library for handling dates, times, and timestamps, offering a more intuitive and human-friendly API for working with temporal data.
Code example:
pip install arrowimport arrow

# Getting the current time in a specific timezone
local_time = arrow.now()
utc_time = arrow.utcnow()

print(f"Local Time: {local_time}")
print(f"UTC Time: {utc_time}")
Screenshot:
 21. NetworkX
NetworkX is a Python library for creating, analyzing, and visualizing complex networks, suitable for tasks in graph theory and network analysis.
Code example:
import networkx as nx
import matplotlib.pyplot as plt

# Creating a simple graph
G = nx.Graph()
G.add_nodes_from([1, 2, 3])
G.add_edges_from([(1, 2), (2, 3)])

# Visualizing the graph
nx.draw(G, with_labels=True, font_weight=''bold'')
plt.show()
Screenshot:
 22. Pygame
Pygame is a set of Python modules designed for writing video games, providing functionalities for game development, multimedia, and interactive applications.
Code example:
import pygame
import sys

# Initializing Pygame
pygame.init()

# Creating a Pygame window
window = pygame.display.set_mode((400, 300))
pygame.display.set_caption(''Pygame Window'')

# Main game loop
while True:
    for event in pygame.event.get():
        if event.type == pygame.QUIT:
            pygame.quit()
            sys.exit()

    pygame.display.flip()
Screenshot:
 Click https://www.pygame.org/wiki/Contribute to go to Pygame web page.
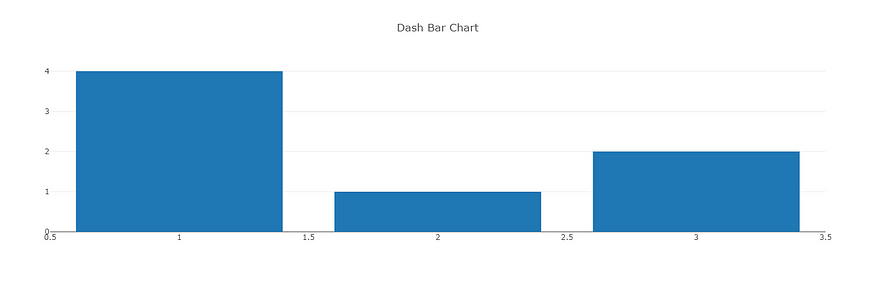
23. Dash
Dash is a Python web framework for building interactive web applications, particularly useful for creating data visualizations and dashboards.
Code example:
pip install dashimport dash
from dash import dcc, html

# Creating a simple Dash app
app = dash.Dash(__name__)

app.layout = html.Div(children=[
    html.H1(children=''Dash Example''),
    dcc.Graph(
        id=''example-graph'',
        figure={
            ''data'': [{''x'': [1, 2, 3], ''y'': [4, 1, 2], ''type'': ''bar'', ''name'': ''Bar Chart''}],
            ''layout'': {''title'': ''Dash Bar Chart''}
        }
    )
])

if __name__ == ''__main__'':
    app.run_server(debug=True)
Screenshot:
 24. PyCaret
PyCaret is an open-source, low-code machine learning library in Python, designed to streamline the machine learning workflow by automating various tasks such as feature engineering, model selection, and hyperparameter tuning.
Code example:
pip install pycaretfrom pycaret.datasets import get_data
from pycaret.classification import *

# Loading a classification dataset
data = get_data(''diabetes'')

# Setting up PyCaret environment
exp1 = setup(data, target=''Class variable'')

# Comparing different models
compare_models()
Screenshot: Refer Google Colab Notebook for output
I trust that this article proves beneficial. Be sure to explore Eugeniu Ghelbur’s comprehensive piece on essential Python libraries for data analysis at https://medium.com/@e.ghelbur/what-are-the-key-python-libraries-for-data-analysis-143a13350860.
Google Colab Notebook: https://colab.research.google.com/drive/1AL3REx02CF3CfR2ACZTbTNzr4Wv1Z1Hj?usp=sharing
Source: Internet
Reference: https://medium.com/@e.ghelbur/what-are-the-key-python-libraries-for-data-analysis-143a13350860
Special Thanking: Eugeniu Ghelbur

Comments
Loading comments…