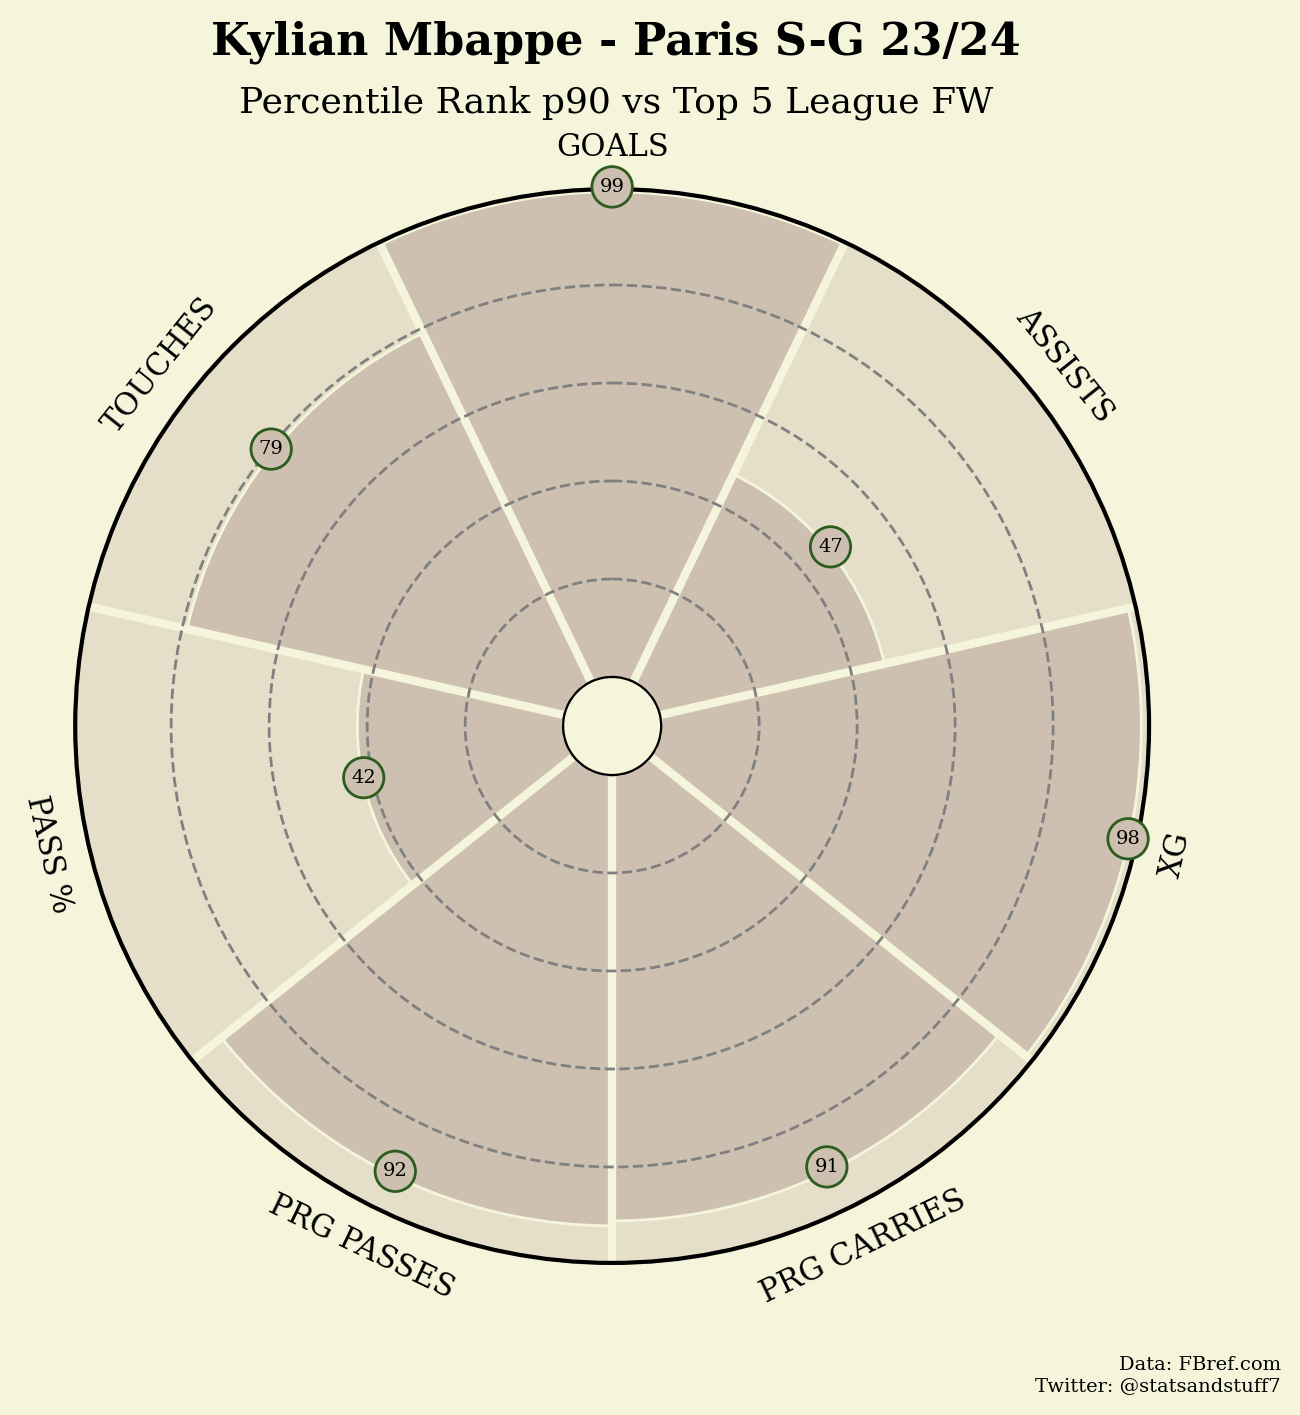
In the modern sports world, data has never been so accessible. Football --- soccer for any American readers --- is no exception, everything can be tracked down to the most granular of details. I've seen reports on the amount of times a player scans (looks behind him to see where opposition players are) before he receives the ball per game!
As data analytics becomes prevalent in the world of sport, the different methods of quantifying both player and team performance fascinate me. Newer measures such as Expected Goals (xG), Expected Assists (xA), Non-Penalty Expected Goals+Assisted Goals (npxG+xAG) have completely revolutionized the way we judge football players. *Goodbye eye-test. *There is an argument that a greater focus on statistics may deprecate our appreciation of the smaller, intangibles that occur between the white lines--- but I digress.
In this thought experiment, I posit another method of evaluating performance: the Average Percentile Score (APS). In essence, the APS is an aggregated measure of player performance, relative to their counterparts.
The score is calculated by finding the percentile score for multiple metrics of interest e.g. Goals/90, Assists/90, Aerial Duels and Key Passes, then finding the average score of these metrics. The aim is to provide an idea of overall relative performance and can be used to measure how well-rounded a player is performing (using a lot of inputs) and even identify similarly performing players (using specific inputs).

Case Study: *You are a scout for *[insert your favorite football team] and have been tasked with finding a group of midfielders with certain characteristics by the head of recruitment. You have a long list of players in the big 5 leagues and you're looking for players with high volume key passes, touches and progressive carries.
for i in df["pos"]:
    if i == "MF":
        midfielders = df.loc[df["pos"] == "MF"]
        midfielders = midfielders[["player", "age", "prgc", "kp", "touches"]]
        mid_pct = ((midfielders.rank(axis=0, numeric_only=True, pct=True))*100).round(decimals=1)
        mid_pct.insert(0, "player", midfielders["player"])
        mid_pct.insert(1, "age", midfielders["player"])
        mid_pct["avg"] = mid_pct.mean(numeric_only=True, axis=1).round(decimals=1)

mid_pct.nlargest(15, "avg")
- Enzo Le Fée: 99.2
- Kevin De Bruyne: 98.9
- Neymar: 98.7
- Lionel Messi: 98.4
- Rémy Cabella: 97.4
- Bruno Fernandes: 97.3
- Sergi Darder: 97.2
- Martin Ødegaard: 96.6
- Rodri: 96.2
- Jean-Ricner Bellegarde: 96.0
- Declan Rice: 95.9
- Achraf Hakimi: 95.6
- Pedri: 95.6
- Bernardo Silva: 95.4
- Nicolò Barella: 95.3
Take a look at Enzo Le Fée! His average percentile score for key passes, touches and progressive carries is 99.2 relative to the midfielders in the big 5 leagues. The APS has allowed you to narrow down a large pool of players to subset of high performing ones but this can then be filtered by attainability i.e. age, value, injury history and so on.
To conclude, the Average Percentile Score is a malleable form of descriptive analytics that can be used to evaluate the overall relative performance of players in specified metrics. There is scope to add weighting to certain inputs if they are "worth" more, these weights could be determined by the practitioner. A linear regression could also be employed to determine which metrics are most important for predicting player performance. Currently, the assumption is that all of the input variables are equally weighted.
There is also scope to use unsupervised methods such as clustering to find similar player profiles then calculate the APS. This would help to refine the resulting output further. More on unsupervised methods here.
For practical purposes, I have built the following interface to see the APS in action, click here.
If you've made it this far, any and all scrutiny is not only welcome but encouraged. For contact, email me: remiawosanya8@gmail.com
Comments
Loading comments…