One of the fascinating features of AWS Lambda is that it automatically monitors the Lambda function, which gives you the opportunity to view the metrics in the Amazon CloudWatch. It concerns not only your logs implemented (with console object for NodeJS, print function for Python, etc), but also the errors caught during the invocations.
Having used the Lambda functions for more than 2 years, here is my top 3 picks of AWS Lambda errors:
1. Unknown application error occurred

Um… Alright.
Let's wrap the code into the try-catch block. Didn't help? Well, seek if your function creates a connection to another AWS service like Parameter Store or some Database service, like Aurora. Searching for the logs in the CloudWatch, you'll see the an error like:
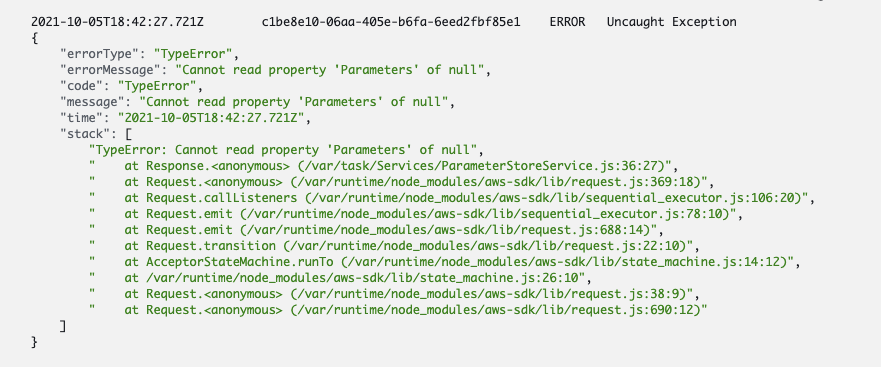
right after the Unknown application error occurred error message. From my practice, the error happens on the (rare) unexpected connection termination.
One possible solution: put a retry block (or trigger it again) in 10 seconds, making sure you've closed the connections your function was intended to do.
2. Runtime exited with error: signal: killed
This had indeed made my blood run cold. It is also not present in the Invoking Errors list, but don't worry — as the practice shows, it happens due to the memory leak or a simple fact your function needs more memory.
One possible solution: check for memory leak and, if not, increase the function memory.
3. RequestEntityTooLargeException: Request must be smaller than …
This one is the easiest one to fix.
Most probably, you're invoking your function with AWS SDK. Having the 2 types of invocation with a payload:
-
Event (asynchronous invocation)
-
RequestResponse (synchronous invocation)
AWS also sets an incoming payload limit for them of 256 KB and 6 Mb respectively. Thus, a solution would be to check the invocation type and adjust the one you need for your payload. If the payload exceeds the maximum amount of 6 Mb for RequestResponse, for example, separate the payload into batches.
Bonus tips:
-
Always do wrap your handler into a try-catch block— that's indeed helpful for troubleshooting. Again, printing the error and/or trace in the catch block is pretty much-obliged while debugging. Moreover, send and monitor those errors through some tool like Slack, which helps you to be aware of the error immediately without checking the logs! If you need the tutorial for it, let me know.
-
Searching for
- "START" - "END" - "REPORT" - "INFO"
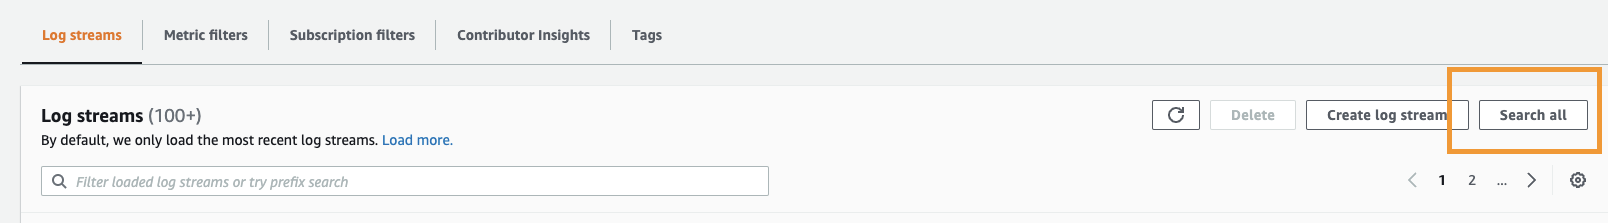
in the log groups will show you the logs groups containing the errors, so that you won't be opening every single log stream of the time error happened searching for the error message. To do so,
- Click on Search All in the CloudWatch logs main page:
- Paste it and select a desired time range from the right:

Hope, you enjoyed reading it! 🤞
Open for your comments and suggestions in comments 📝. And feel free to contact me on LinkedIn as well.
Comments
Loading comments…