As someone who has been quite fond of LLMs and has been developing LLM applications, one thing I am always playing with is the LLM settings, which include parameters like Temperature, Top-K, Top-P.
Here’s a great example of how a Claude LLM API in AWS Bedrock service can be accessed in code using the Bedrock boto3 client
body = json.dumps(
            {
                "prompt": f"{prompt1}",
                "max_tokens_to_sample": 300,
                "temperature": 1,
                "top_k": 250,
                "top_p": 0.99,
                "stop_sequences": [
                "\n\nHuman:"
                ],
                "anthropic_version": "bedrock-2023-05-31"
            }
        )
modelId= "anthropic.claude-v2:1"
contentType= "application/json"
accept= "*/*"

response = bedrock.invoke_model(body=body, modelId=modelId, accept=accept, contentType=contentType)
You may have noticed the "temperature": 1, "top_k": 250, "top_p": 0.99, part of the code that a lot of users are using without knowing what they actually mean. Most know that the parameters control the creativity or the diversity of LLM outputs but don't know the inner workings.
To understand these parameters, we first have to understand how LLMs work. They basically predict the next tokens. For a context of “Once upon a time, there was a unicorn,” it will continue with “Once upon a time, there was a unicorn, that lived in a magical…”
The new LLMs, like ChatGPT, are fine-tuned on instructions so that they would follow instructions. A technique called RLHF: Reinforcement Learning with Human Feedback is used. But their working is still based on predicting the next token.
The picture below shows how the predictions work with the probability distribution of the next token after “Once upon a time, there was a unicorn, that lived in a magical…”. As seen in the figure, the word “forest” has the highest probability of being the next token. The next token is selected based on these probabilities.
And this is where the parameters come into play.
Top-K
Top-K is the simplest one; top k = 4 means that the top 4 tokens are the only ones possible, the rest are discarded. This can be seen in the following figure. An additional softmax can be applied to make the cumulative probability 1 and make predictions based on these 4 possible tokens.
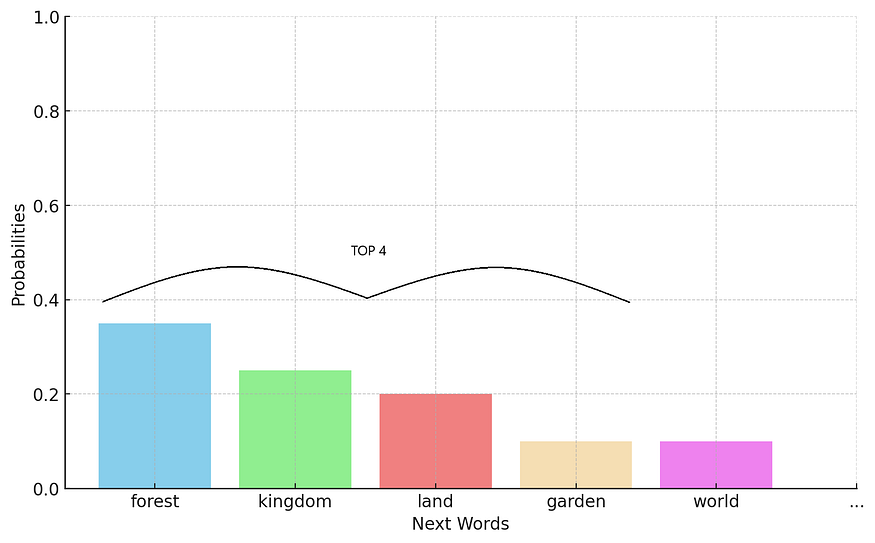
TOP K = 4. So, the top 4 tokens are selected.
Effect of Top-K on Randomness:
The “top-k” method influences how a big AI language system picks words to form its responses. Imagine you have a jar of your favorite candies but you only reach for the top layer every time. With a low “k” value, the AI does the same by choosing from a small, predictable set of words — like sticking to the candies you can see right at the top. This makes its responses quite consistent but maybe a bit boring, because it’s not exploring the variety underneath.
If you increase “k”, it’s like digging deeper into the jar and discovering more flavors. The AI starts considering a wider range of words, which can make the conversation more interesting and less predictable. For example, with a high “k”, instead of always saying “happy”, it might say “elated”, “joyful”, or “thrilled”. But, if “k” is too high, it might also pick words that don’t fit well, making the conversation seem a bit random. It’s about striking the right balance to keep the AI’s replies both engaging and on point.
Top-P
For Top-P, the value can vary from 0 to 1. It uses the top tokens whose cumulative probability just exceeds the Top-P value. A 0.8 value of Top-P means the top tokens will be used whose cumulative probability just exceeds 0.8.
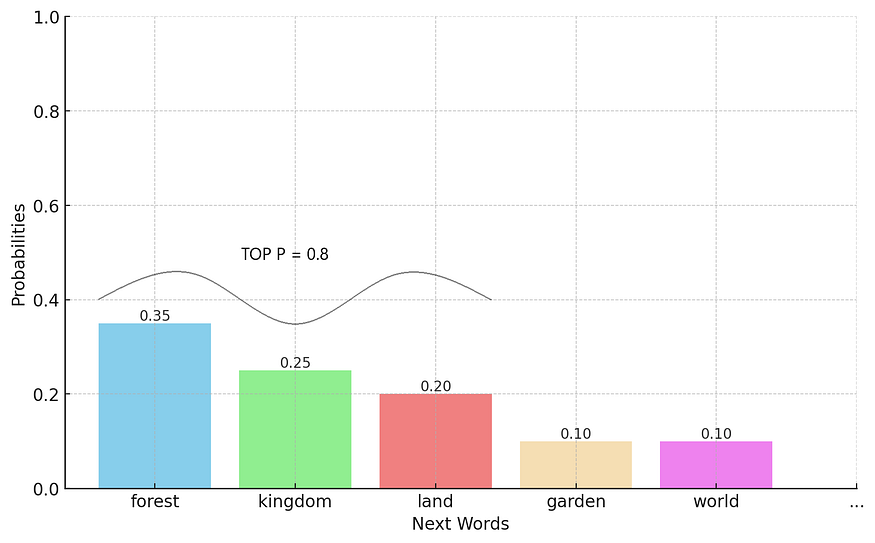
TOP P= 0.8. So, the top 3 tokens with cumulative probability = 0.8 (0.35+0.25+0.20) are selected.
Effect of Top-P on Randomness:
The “top-p” method in big AI language systems is like deciding how adventurous you want to be when choosing what to eat at a buffet. With a low “p” value, the AI acts cautiously, sticking to the most popular dishes or words it knows will work well in most conversations. This makes its responses reliable and coherent but can also make them predictable and less varied. For example, if it’s often choosing common phrases like “I agree” or “That’s good,” it’s like always going for the salad and mashed potatoes.
On the other hand, a high “p” value is like being more adventurous and trying a bit of everything from the buffet, including the exotic dishes. The AI becomes more creative and can surprise you with unique responses, pulling from a wider selection of words. For instance, instead of saying “I’m happy,” it might say “I’m over the moon,” or instead of “very big,” it might choose “colossal.” However, just like trying too many new dishes at once can lead to a mix that doesn’t quite work, setting “p” too high can make the AI’s responses feel disjointed or off-topic. It’s all about finding the sweet spot where the AI is adventurous enough to be interesting but still makes sense.
Temperature sampling
Temperature sampling is a bit more complicated. Temperature sampling is a technique used in various machine learning models, especially in generative models like neural language models, to control the randomness of predictions by adjusting the temperature parameter (T). This technique is applied to the logits (i.e., the raw output scores before applying the softmax function) of a model to affect the distribution of the output probabilities.
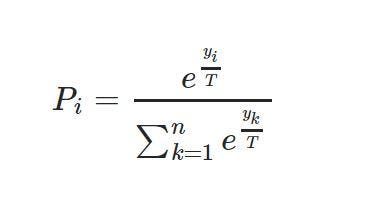
Temperature sampling Formula
is a variation of the softmax function where yi are the logits corresponding to each class i, T is the temperature, and n is the total number of classes. The output P(i) represents the probability of class i after temperature scaling.
Effect of Temperature (T) on Randomness:
- When T
>1: Increasing T makes the distribution more uniform (flatter), increasing the randomness of the sampling. This happens because as T grows, the difference between the largest and smallest logits has less impact on the resulting probabilities, making less likely events more probable. - When T
=1: The model behaves normally, with no modification to the logits before applying the softmax function. The probabilities reflect the model’s learned distribution. - When T
<1: Decreasing T makes the distribution sharper, reducing randomness. Lower temperatures increase the disparity between the higher and lower logits, making the model’s predictions more deterministic (i.e., the highest logit value(s) dominate the probability distribution).
These effects can be seen in the following figure.
Graph for Temperature = 1, 0.5 and 1.5
If T is increased, the randomness in the model’s output distribution increases. This is because a higher temperature leads to a flatter (more uniform) probability distribution, giving lower-probability events a higher chance of being selected. This feature of temperature sampling allows for a tunable balance between exploration (high T, more randomness) and exploitation (low T, less randomness) in the model’s predictions.
In this way, the parameters Top-P, Top-K, and temperature can be used to control the randomness of the LLM output, i.e., its creativity. I hope you found this article informative and that it has shed some light on the nuanced settings that power the behavior of modern language models. Please feel free to clap and share this article to help it reach as wide an audience as possible.
Comments
Loading comments…