What Is AWS Lambda?
AWS Lambda is a compute service provided by Amazon Web Services that allows users to run code without having to provision or manage servers (i.e., a serverless model). Lambda lets you execute code for almost any backend service or application, with no administration requirements. Simply upload the code and Lambda will handle everything needed to run and scale the code and achieve high availability.
What Is Network Monitoring?
Network monitoring is the process of systematically and continuously monitoring the performance, availability, and overall health of a computer network, including the devices and services connected to it, in order to detect and diagnose network-related problems and ensure that the network is functioning properly.
Network monitoring tools and systems collect various types of data, such as network traffic, device status, and resource utilization, and use that data to generate alerts, reports, and other forms of information that can be used to identify and troubleshoot network issues and improve network performance. They are critical for performance, service uptime, and network security.
VPC Networking for Lambda
AWS Lambda makes it possible to run code without handling servers. All Lambda functions run inside a VPC by default, which can access the Internet and is entirely managed by AWS. These VPCs are part of AWS's infrastructure and are controlled by the cloud provider. Alternatively, you can configure your own settings.
To control access to resources within a VPC, you can configure a Lambda function to connect to your own VPC by specifying one or more VPC subnets and security groups in the function's configuration.
When a Lambda function is connected to a customer VPC, it can access resources in the VPC, such as Amazon RDS database instances, Amazon Elasticache clusters, CI/CD tools like AWS CodeCommit and AWS CodePipeline, and other AWS resources. However, it also means that the function has to traverse the network to reach the Internet and incur additional latency.
Using Amazon CloudWatch with Lambda Insights
Lambda Insights is a feature in Amazon CloudWatch that allows you to troubleshoot and monitor your AWS Lambda functions. It allows you to view detailed metrics and traces of your Lambda functions, including invocation counts, duration, and error rates, as well as traces of specific function invocations to help you identify and diagnose issues. Lambda Insights also integrates with full Lambda monitoring solutions, like Lumigo and Amazon X-Ray.
Using Lambda Insights, you can:
- View detailed metrics such as the number of invocations, errors, and the duration of each invocation.
- View traces of specific function invocations to understand the flow of a request and identify any issues or bottlenecks.
- Set alarms on specific metrics to get notified when certain thresholds are breached.
- Use the built-in troubleshooting guide to identify and fix common issues with your Lambda function.
To use Lambda Insights, you will need to enable it for your function in the CloudWatch console, and then specify the function name and the desired level of detail for the metrics and traces. Once enabled, the metrics and traces will be automatically collected and stored in CloudWatch for you to view and analyze.
The dashboard
The CloudWatch console includes a Lambda Insights dashboard, which has two main views:
- The multi-function overview: A summary view that provides a high-level overview of the performance of all the Lambda functions that you have enabled Lambda Insights for. It displays information such as the number of invocations, errors, and the average duration of invocations for each function. You can also see a breakdown of the different invocation types, such as synchronous or asynchronous invocations, and filter the data by different time ranges.
- The single-function view: Provides a more detailed view of a specific function, including information about the different versions of the function and the different resources it is using. You can view more detailed metrics, such as the number of invocations by different error types, the duration of each invocation, and the number of function calls by different invocation types. Additionally, you can view traces of specific function invocations, which allow you to see the flow of a request and identify any issues or bottlenecks.
The single-function view also allows you to set alarms on specific metrics and view a troubleshooting guide that helps you identify and fix common issues with your Lambda function. This view is particularly useful when you want to investigate a specific function or when you want to optimize the performance of a single function.
To view runtime metrics for all your functions:
- Open the CloudWatch console in the AWS Management Console.
- In the navigation pane, choose Lambda, then choose Insights.
- On the Lambda Insights dashboard, you will be able to see the multi-function overview. This view shows a summary of the performance of all the Lambda functions that have Lambda Insights enabled.
- On the multi-function page, choose a predefined time range or set a custom time range.
- Select Add to dashboard and this widget will be added to the CloudWatch dashboard (Optional).
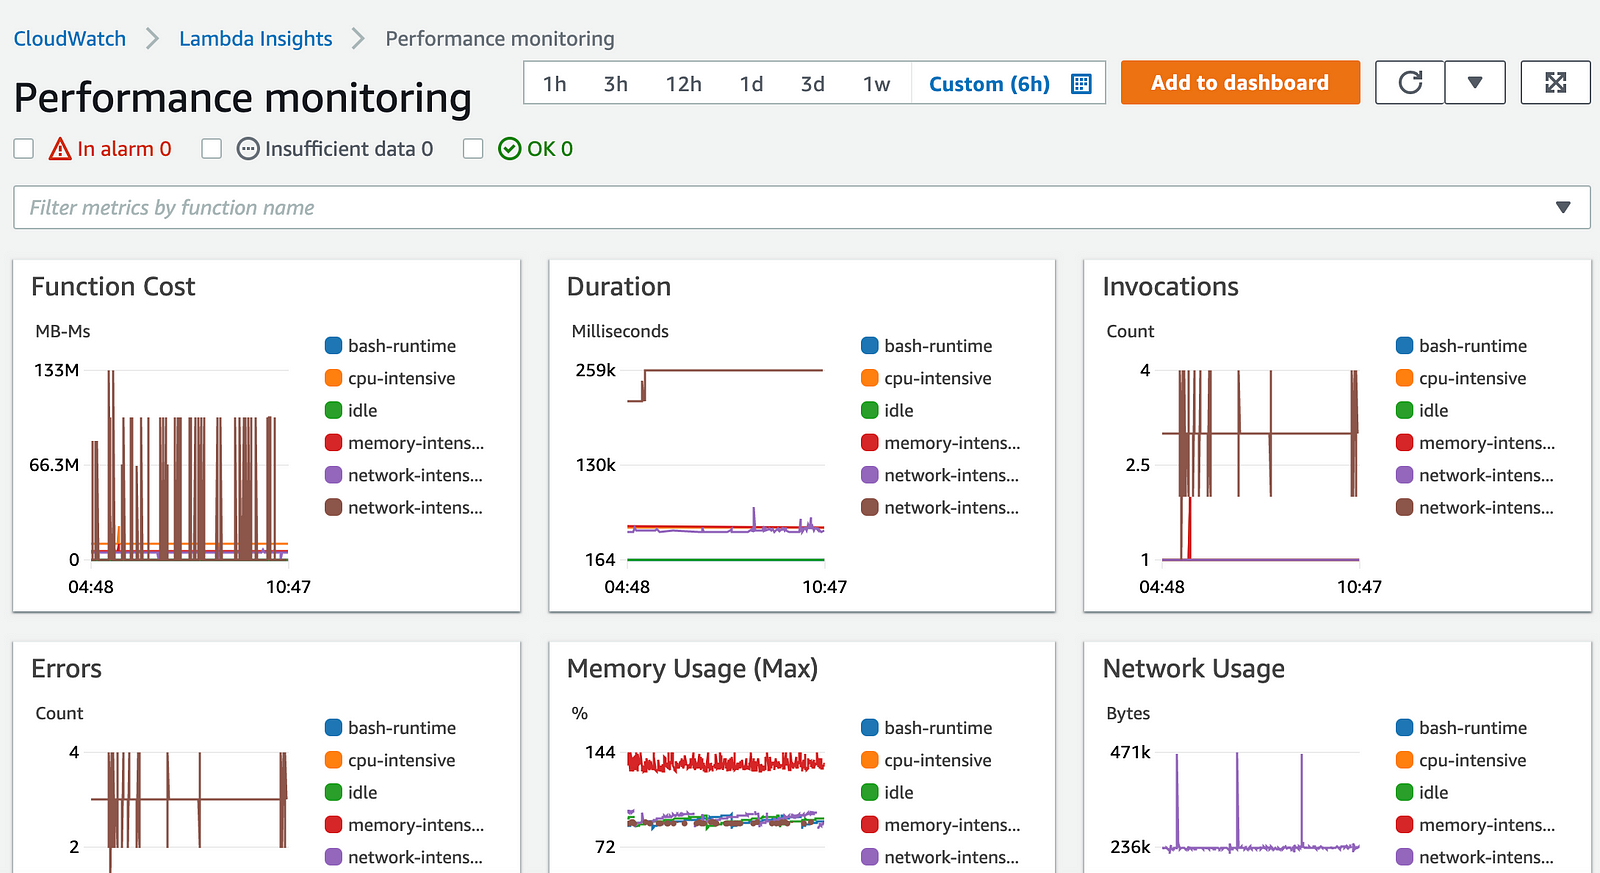
Image Source: AWS
To activate anomaly detection for a Lambda function"
- Go to the CloudWatch console and open the multi-function page.
- Locate the Function summary, and select the desired function's name. This will open the single-function view with function runtime metrics.
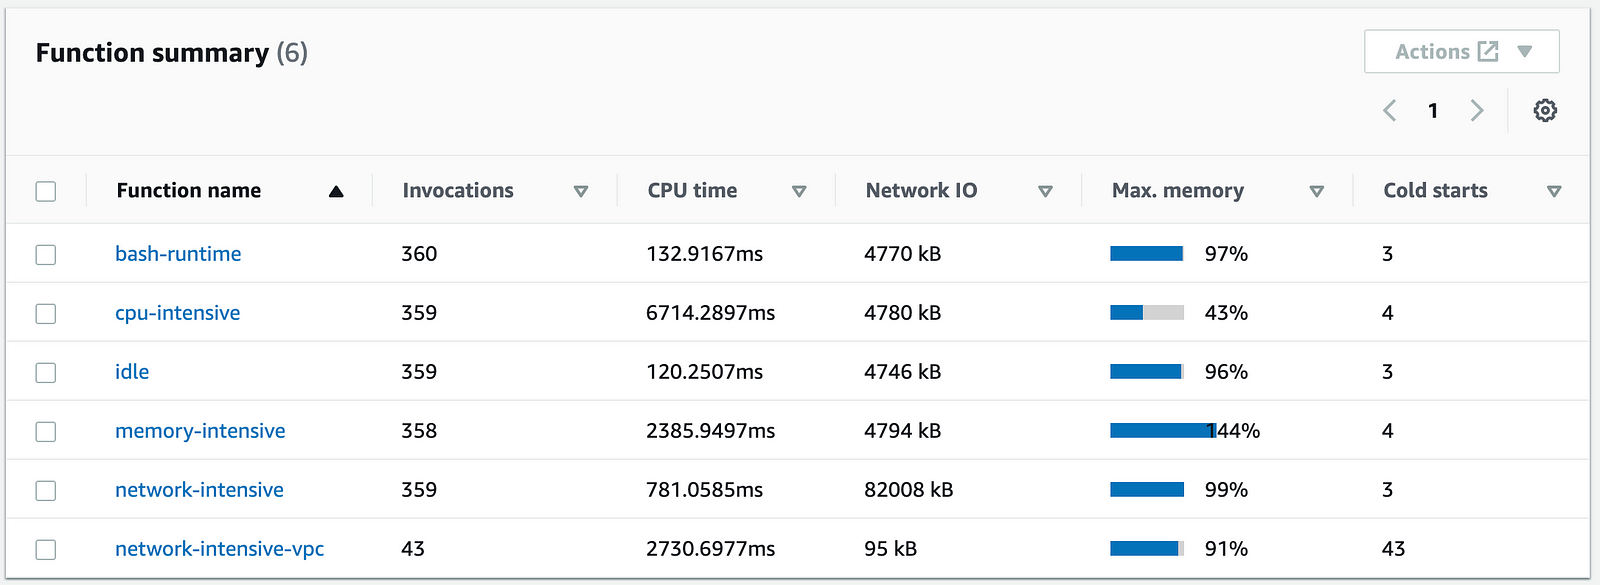
Image Source: AWS
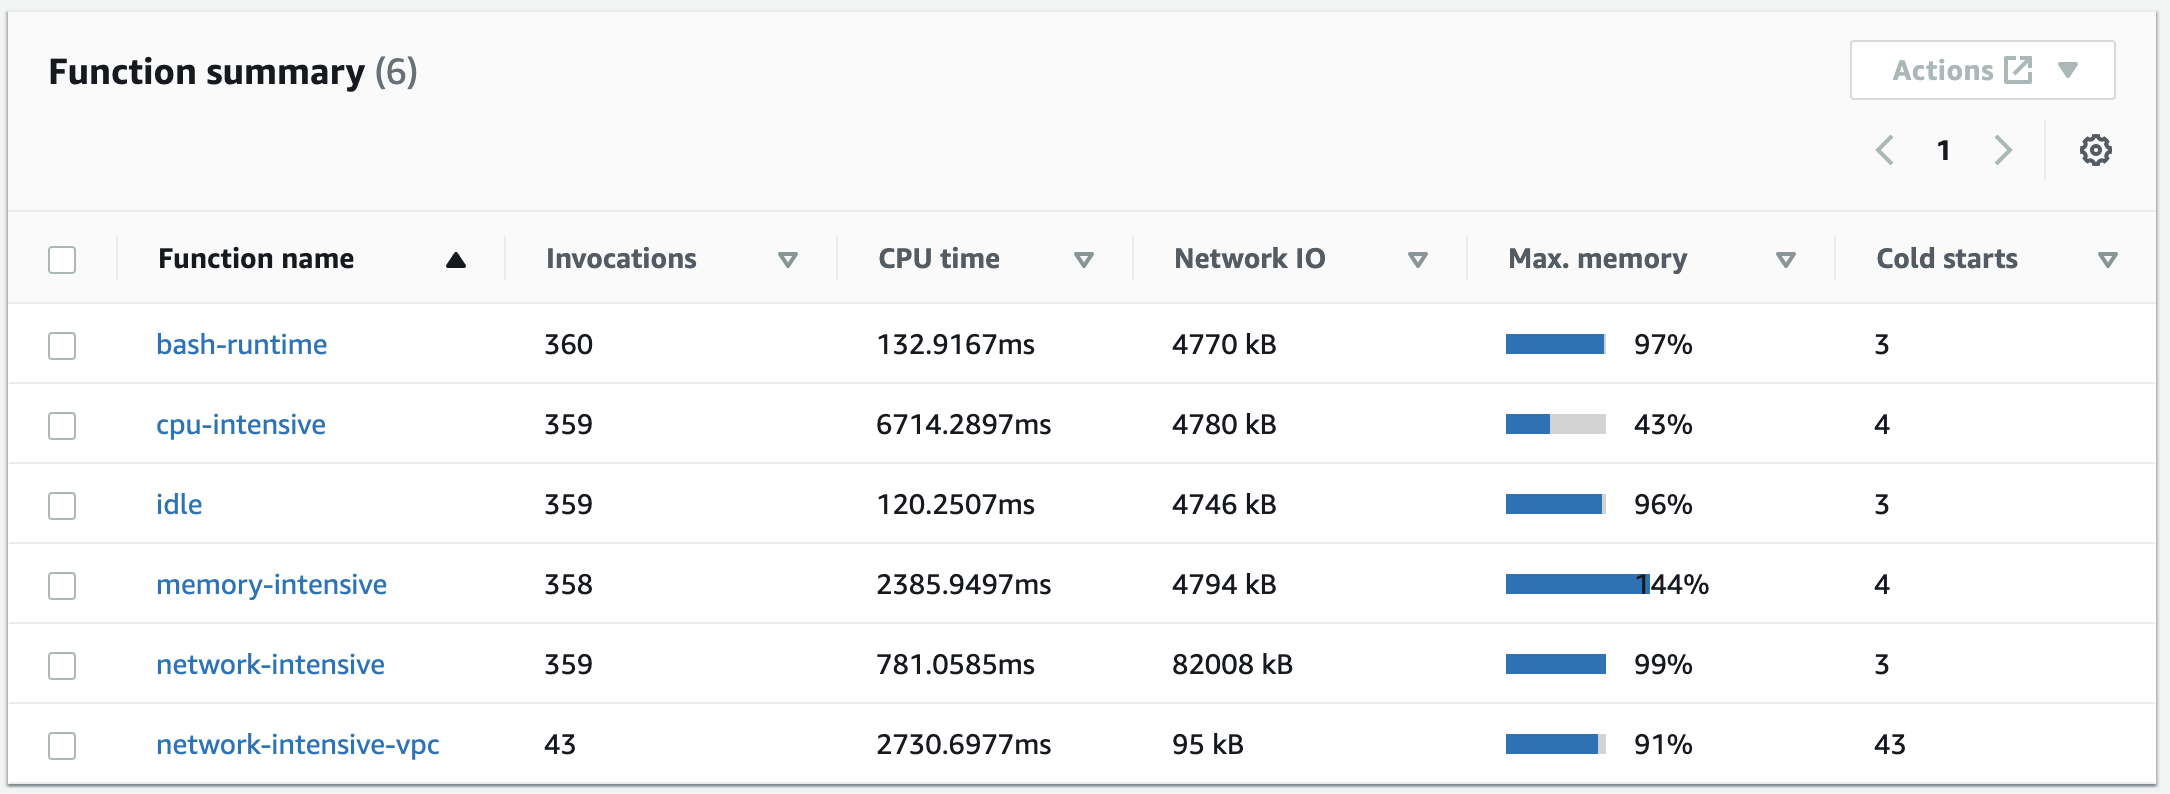
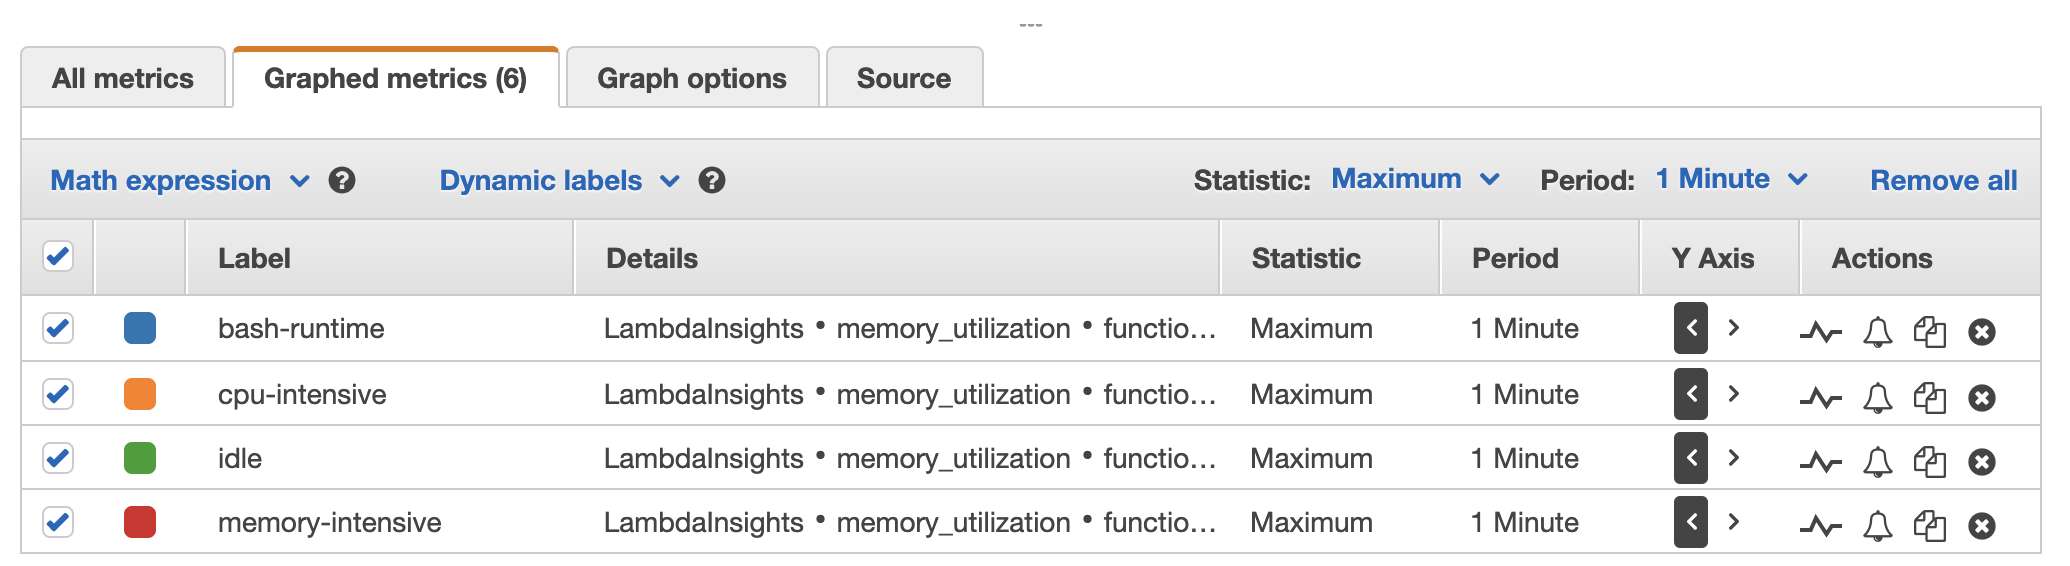
- Find the Memory Usage pane, select the option with three vertical dots, and choose the View in metrics option to open your Metrics dashboard.
- Go to the column under Actions, find Graphed metrics, and select the first icon to activate anomaly detection for this function.

Image Source: AWS
Conclusion
Network monitoring is a critical aspect of managing and optimizing Amazon Lambda applications. By using tools such as AWS Lambda Insights and CloudWatch, you can monitor the performance, availability, and overall health of your network, identify and diagnose network-related problems, and ensure that your Lambda applications are functioning properly.
With the ability to view detailed metrics and traces, set alarms on specific metrics, and use built-in troubleshooting guides, you can optimize the performance of your Lambda functions and improve the overall user experience. Additionally, by enabling anomaly detection, you can detect abnormal changes in your function's performance automatically, and take appropriate actions to fix issues.
Comments
Loading comments…