Using Python, Pandas & Great Expectations
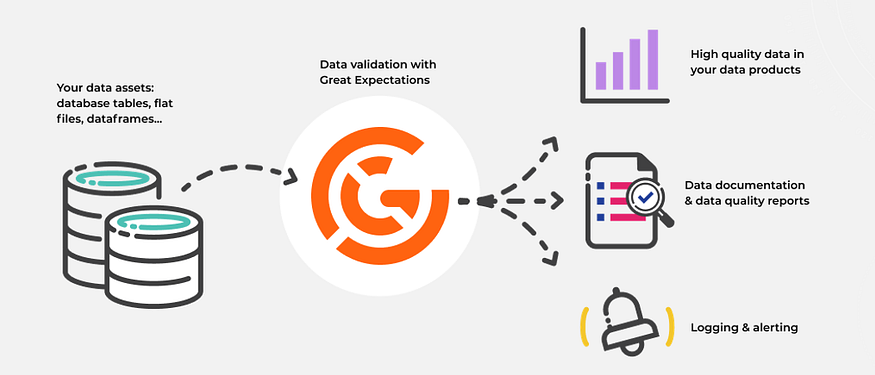
With Great Expectations you can expect more from your data. Great Expectations is one of the leading tools for validating, documenting, and profiling your data to maintain quality. Data Quality is key to making informed decisions. Inaccurate data erodes users’ trust and adaptability of the data platform. Therefore, it is essential to have Data Quality tests in place when developing a data pipeline.
Today we are going to cover the Great Expectations library for Data Quality testing. Previously we have used PyTest to carry out data quality tests. With PyTest we wrote our own functions to perform testing. The Great Expectation library has built-in functions to carry out the data quality tests.
If you are a visual learner then I have an accompanying video on YouTube with a walk-through of the complete code.
This tutorial will:
- Familiarize you with various built-in Great Expectations functions
- How to apply these functions to our dataset
- Save the the Data Quality Tests to config file and re-use them
The only prerequisite for this tutorial is Great Expectations, make sure it is installed on your system.
pip install great_expectations
# check the install
great_expectations --version
We will use Jupyter Notebook as an IDE. Let’s open our Jupyter Notebooks. As usual the completed notebook is available on GitHub. In the Notebook import our libraries; pandas and great expectations. Using Pandas we read the product dataset into a pandas DataFrame.
import great_expectations as ge
import pandas as pd
#
url = "https://github.com/hnawaz007/pythondataanalysis/blob/main/ETL%20Pipeline/Pytest/Session%20one/Product.xlsx?raw=true"
# read from url
df=pd.read_excel(url)
df.head()
We preview the data in the DataFrame to familiarize ourselves with columns and their data type. In order to run Great Expectations tests on this dataset we need to convert it to Great Expectations DataFrame. We can convert it with the from_pandas function from the great library. We can check the type to make sure it is the correct type. Otherwise, we won’t be able to run the following tests on it.
my_df = ge.from_pandas(df)
# check the type
type(my_df)
All Great Expectations tests start with expect keywork. Great Expectations offers various built-in test. You can read about them on their glossary page. Let’s start with row count in our DataFrame. We can check how many records we have in our DataFrame. Our table row count expectation fails. We can see that the success is false and the actual number of records in this table are six hundred and six. We expected thousand rows in this table.
# check number of rows in the dataset
my_df.expect_table_row_count_to_equal(1000)
{
  "exception_info": {
    "raised_exception": false,
    "exception_traceback": null,
    "exception_message": null
  },
  "success": false,
  "result": {
    "observed_value": 606
  },
  "meta": {}
}
We will explore some of these tests that make sense for our dataset. If you recall in PyTest we wrote our own functions to test the assumptions about our data. However, Great Expectations provide us with built-in functions. We apply them to our dataset to test the data quality. Let’s start with the primary key column. First of all, we check if the column exists in the dataset with the expected column to exist and provide it the column name, ProductKey. This displays the result of the test and whether it succeeds or fails.
# check if column exists
my_df.expect_column_to_exist('ProductKey')
{
  "exception_info": {
    "raised_exception": false,
    "exception_traceback": null,
    "exception_message": null
  },
  "success": true,
  "result": {},
  "meta": {}
}
Next, we find out if our primary key is unique. This returns a little more information about the test. We get the status which is a success. It gives us the total record count and whether we have missing values and what percentage is missing. On both accounts it is zero. Which is a good sign. Our primary key columns look in good shape. We can perform a null test to check if it contains any nulls with our next test. This is a success as well. Our source system is producing some good data. Let’s wrap it up with a data type test. We know this column is of type integer so we put this assumption to test.
# check for uniqueness
my_df.expect_column_values_to_be_unique('ProductKey')
# check for nulls
my_df.expect_column_values_to_not_be_null('ProductKey')
# data type check
my_df.expect_column_values_to_be_in_type_list("ProductKey", ["int", "int64"])
Let’s move on to other columns in our dataset. We check if certain columns contain values in a set. For example, we have a product line column that groups the values into four categories. We can perform this test on columns with few distinct values such as region or product category that contains 4–10 distinct values. To expect_column_values_to_be_in_set function we provide column name and the list of expected values. We are checking if the Product Line only contains these four values. This assumption is correct. However, we can see that a lot of values are missing in this column. 226 to be precise or 37 percent.
my_df.expect_column_values_to_be_in_set("ProductLine", ['R ', 'S ', 'M ', 'T '])
{
  "exception_info": {
    "raised_exception": false,
    "exception_traceback": null,
    "exception_message": null
  },
  "success": true,
  "result": {
    "element_count": 606,
    "missing_count": 226,
    "missing_percent": 37.29372937293729,
    "unexpected_count": 0,
    "unexpected_percent": 0.0,
    "unexpected_percent_total": 0.0,
    "unexpected_percent_nonmissing": 0.0,
    "partial_unexpected_list": []
  },
  "meta": {}
}
Next, we will test if the column values are between a range. We can perform this test on a numeric column to check if they fall in a certain range. For example, the Safety stock level can be between one and thousand. We can apply the same test on the days to manufacture columns. We expected it to be between one and 10. This assumption is true. So, we are producing products in a timely manner.
# check values in range
my_df.expect_column_max_to_be_between("SafetyStockLevel", 1, 1000)
# check days to manufacture range
my_df.expect_column_max_to_be_between("DaysToManufacture", 1, 10)
We can also check the average of a column to be between a range. For example, we are testing if Standard Costs mean is between 100 to 500 and this test passes so our assumption is true. The actual mean is 434.
my_df.expect_column_mean_to_be_between("StandardCost", 100, 500)
{
  "exception_info": {
    "raised_exception": false,
    "exception_traceback": null,
    "exception_message": null
  },
  "success": true,
  "result": {
    "observed_value": 434.26582886075965,
    "element_count": 606,
    "missing_count": 211,
    "missing_percent": 34.81848184818482
  },
  "meta": {}
}
If some of our columns are sparsely populated but we still want to check if a certain percentage is expected to be populated then we can use the mostly parameter. In this case we are checking if the Color column is populated with values 55 percent. This returns true as 41 percent values are missing from this column.
my_df.expect_column_values_to_not_be_null("Color", mostly=0.55)
One of the good features of Great Expectations is that we can save or export all the tests we ran and use them later on. This comes in handy as we run our data pipelines daily and, on each run, we perform these tests using a config file.
# export the assertions to a config file
my_df.save_expectation_suite('product.data.expectations.json')
Let’s run the tests with our config. We load the config file and set this equal to expectation_suite parameter inside the validate function. We save the results into a variable. Now we can check the results of all the tests. Using this method, we can inject the Great Expectations test cases into our data pipeline.
# read the dataset into ge DataFrame
df2 = ge.read_excel(url)
# read the assertions from config file
test_results = df2.validate(expectation_suite="product.data.expectations.json")
# Take action based on the results
if test_results["success"]:
    print ("Awesome. All Data Quality Tests are green!")
else:
    raise Exception("You've got issues.")
Awesome. All Data Quality Tests are green!
All tests pass successfully, so our data is matching our expectation and we can be confident that we have set certain data quality standards and our data is matching them. We can further build on this to include more tests to catch any data quality issues.
Conclusion
- We showcased how easy it is to use Great Expectations test cases.
- We implemented test cases and established data quality standards and prevented inconsistent data flowing into the ETL pipeline.
- The complete Great Expectations tutorial code can be found here
Comments
Loading comments…