This article is going to be a bit special. I am going to test the latest release from Yahoo Finance API for Python, which provide the possibility to get live data with less than a second lag for free.
In this article, you will learn how to get live Forex data, using Python packages without calling an expensive API such as Bloomberg. I have tested it for you. Does that work? Let’s see.
If you are keen to hack it yourselves now, you can get the full Python code at the end of this article.
You will be able to get Forex data such as price, volume and fundamental data using Python packages. (With a lag lower than 0.01 seconds)
This article is a complementary to this article , where I demonstrate how to get market data in less than 3 lines of code.
Before we start
First of all, if you want to track my progress and before to start, you will need to have installed on your machine a Python 3 version and the following packages:
- Pandas
- NumPy
- Yfinance
- Plotly (Not mandatory, but useful for plotting)
If any of these packages are not already installed, you can use the pip command, as shown below.
pip install yfinance
pip install plotly
Once you have ensured that the following packages are installed, we can start.
If you already have experience with Python, you can jump to the second step. The first step will consist of importing data.
1. Import package
The first step will consist of importing the necessary packages.
You will start by importing your packages previously installed by using the following lines of code:
# Raw Package

import numpy as np

import pandas as pd

#Data Source

import yfinance as yf

#Data viz

import plotly.graph_objs as go
Lines above are querying numpy, pandas, yfinance & plotly to be imported.
Once we are set up, let’s move on to the next step. Now that libraries are imported, we can now import markets data.
2. Get connected to the market
Now that the different packages needed have been uploaded. We are going to use JPY/AUD as an example to set up our import through Yahoo Finance API.
Yahoo Finance API will need 3 mandatory arguments in this order:
- Tickers (1)
- Start date + End date or Period (2)
- Interval (3)
For our case, the ticker*(argument 1)* will be JPYAUD=X (Full explanation within the video tutorial). Furthermore, we are going to choose for this example, the last day period*(argument 2)* instead of defining a Start and End date. And we will set up an interval*(argument 3)* of 15 minutes.
To call your data, you will have to use the following structure:
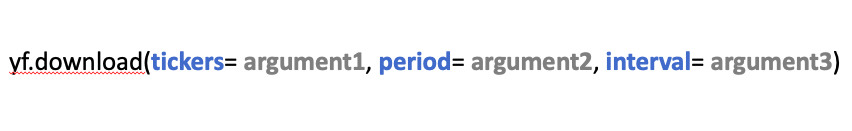
Above described the structure to get market data which interest us.
Before going further, I am going to bring some details on the third argument (interval).
A quick lookup on interval
I want to give you a quick shot on the different interval you can set up using yahoo finance API.
Detailed below the full list of interval possibilities which can be required:
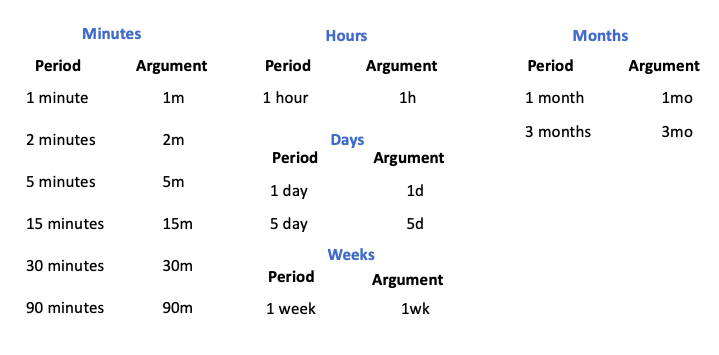
Above are listed the different intervals which can be chosen.
The interval will not interfere with the option to get live data.
Let’s continue.
Live test
At the time when I am executing the line below, we are the 05th February 2021, and it is actually 9:24 PM in London which means that the market is open.
For your information: 9:24 PM UK time corresponds to 5:24 PM New York time.
We have defined our 3 arguments, let’s execute the code below:
data = yf.download(tickers = 'JPYAUD=X' ,period ='1d', interval = '15m')

data
The following line of code are calling Yahoo finance API
For a recap, the following line of code is calling Yahoo finance API and requesting to get data for the last day, with an interval of 15 minutes.
And here is the output:
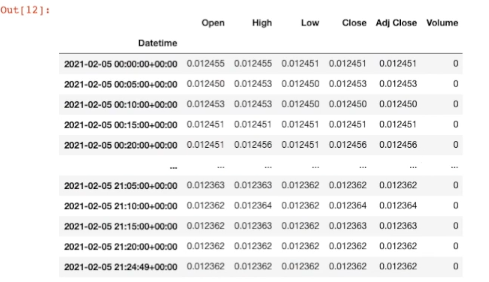
Output released using the code above.
As you can see, you have an update released each second. For instance, if you look at the output below, the latest data provided are given for 9:24 PM and 49 seconds. If you re-run your kernel, the data will be updated again.
Mission accomplished!
I pushed the live test further, and you can watch the data being updated each second, it is impressive. Furthermore, you can get the full code explained in the explanation video below:
Full live test coded and explained in the video above.
And here the final live graph which is spread using Python and Plotly:
Final output: Live graph being updated over time.
Conclusion
Thank you for reading! I hope you have found this useful.
If you’d like to go further with algorithmic trading, check out this article.
Full Python code:
# Raw Package

import numpy as np

import pandas as pd

#Data Source

import yfinance as yf

#Data viz library

import plotly.graph_objs as go

#Download JPYAUD data

data = yf.download(tickers = 'JPYAUD=X' ,period ='1d', interval = '15m')

#declare figure

fig = go.Figure()

#Candlestick

fig.add_trace(go.Candlestick(x=data.index,

open=data['Open'],

high=data['High'],

low=data['Low'],

close=data['Close'], name = 'market data'))

# Add titles

fig.update_layout(

title='Japanese Yen/Australian Dollar')

#Show

fig.show()
Comments
Loading comments…