
**Disclaimer: **The material in this article is purely educational and should not be taken as professional investment advice. Invest at your own discretion.
In this article you will learn a simple trading strategy used to determine when to buy and sell stock using the Python programming language. More specifically you will learn how to perform algorithmic trading. It is extremely hard to try and predict the stock market momentum direction, but in this article I will give it a try. Even people with a good understanding of statistics and probabilities have a hard time doing this.
Algorithmic trading is a process for executing orders utilizing automated and pre-programmed trading instructions to account for variables such as price, timing and volume. -investopedia.com
Python is one of the hottest programming languages for finance along with others like C#, and R. The trading strategy that will be used in this article is called the **Triple Moving Average System **also known as Three Moving Averages Crossover.
What is the Three Moving Average Crossover ?
The three moving average crossover system can be used to generate buy and sell signals. It uses three moving averages, one fast/short, one middle/medium, and one slow/long. These moving averages can be simple moving averages or exponential moving averages.
The strategy is to buy when the fast/short moving average is higher than the middle/medium moving average and the middle/medium moving average is higher than the slow/long moving average. When the fast/short moving average is back below the middle/medium moving average, the system exits. The reverse is true for short trades.
When To Buy & Sell The Stock Using The Strategy ?
Although the three moving average crossover is mostly used for option or futures trading to find a trend for when to go long and go short, I will use those trends as buy and sell signals.
I will also use an exponential moving average for the three moving averages in this strategy. The strategy is described below.
Buy when the middle moving average crosses above the long/slow moving average and the short/fast moving average crosses above the middle moving average. Sell if the short/fast moving average crosses below the middle moving average. or Buy when the middle moving average crosses below the long moving average and the short/fast moving average crosses below the middle moving average. Sell if the short/fast moving average crosses above the middle moving average.
Please leave claps on this article if you find it helpful or entertaining. I would also like to know some of your trading strategies as well in the response section.
If you prefer not to read this article and would like a video representation of it, you can check out the YouTube Video below. It goes through everything in this article with a little more detail, and will help make it easy for you to start programming even if you don’t have the programming language Python installed on your computer. Or you can use both as supplementary materials for learning !
If you are interested in reading more on algorithmic trading then you might want to read Hands-On Machine Learning for Algorithmic Trading: Design and implement investment strategies based on smart algorithms that learn from data using Python. The book will show you how to implement machine learning algorithms to build, train, and validate algorithmic models. It will also show you how to create your own algorithmic design process to apply probabilistic machine learning approaches to trading decisions, and the book will show you how to develop neural networks for algorithmic trading to perform time series forecasting and smart analytics.
Start Programming:
I will start this program with a description.
**#Description: This program uses the three moving average crossover
#             to determine when to buy and sell stock.**
Import the dependencies.
**#Impot the libraries**
import pandas as pd
import numpy as np
import matplotlib.pyplot as plt
plt.style.use('fivethirtyeight')
Next, load the data. Since I am using Googles website to program I need to use Google to upload the data file.
**#Load the data **
from google.colab import files **# Use to load data on Google Colab**
uploaded = files.upload() **# Use to load data on Google Colab**
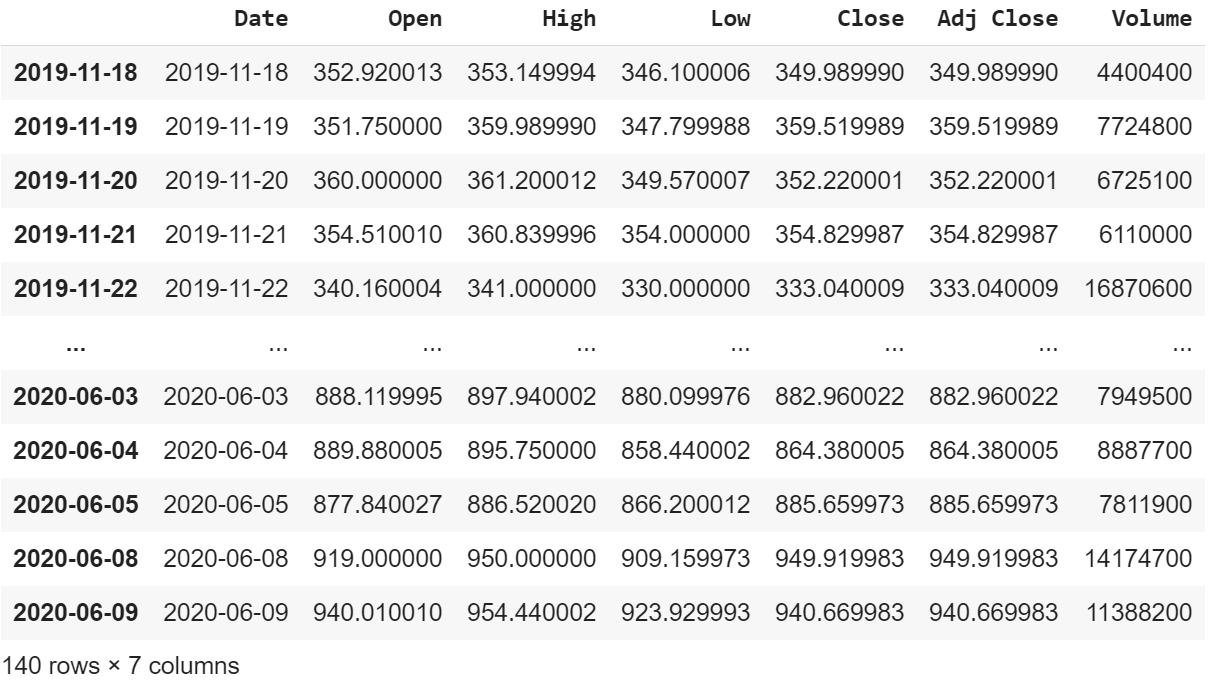
The file that I am uploading is a CSV file named ‘TSLA.csv’ that contains data (Date, Open Price, High Price, Close Price, Adj Close Price, & Volume) for the Apple Corporation stock price from Nov. 17, 2017 to June. 09, 2020.
Next, Store the data in a variable.
**#Store the data into the df variable**
df = pd.read_csv('TSLA.csv')
Show the data in the data set.
df = df.set_index(pd.DatetimeIndex(df['Date'].values))
df
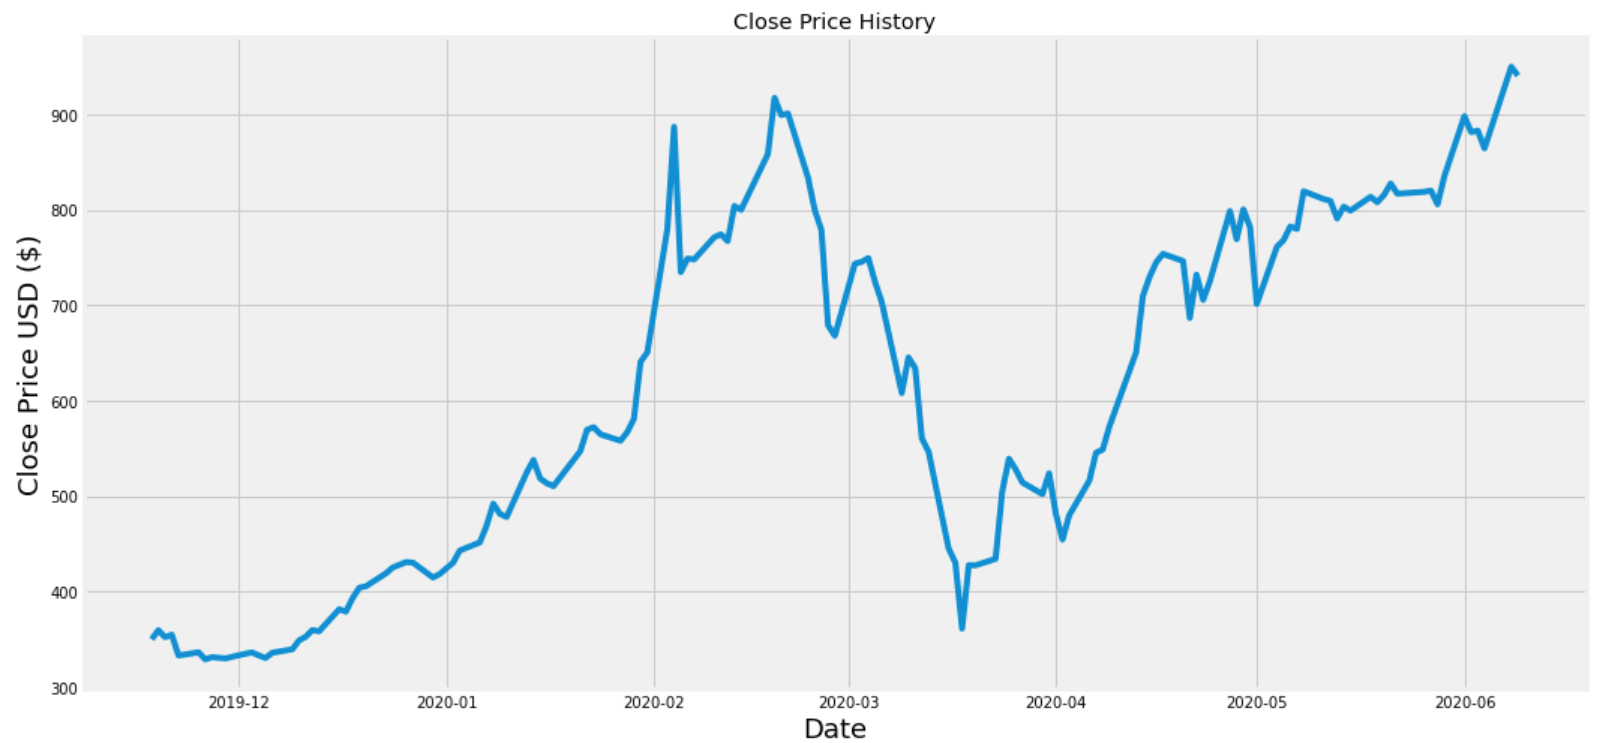
Visually show the stock price.
**#Visualize the closing price history**
plt.figure(figsize=(16,8))
plt.title('Close Price History')
plt.plot(df['Close'])
plt.xlabel('Date',fontsize=18)
plt.ylabel('Close Price USD ($)',fontsize=18)
plt.show()
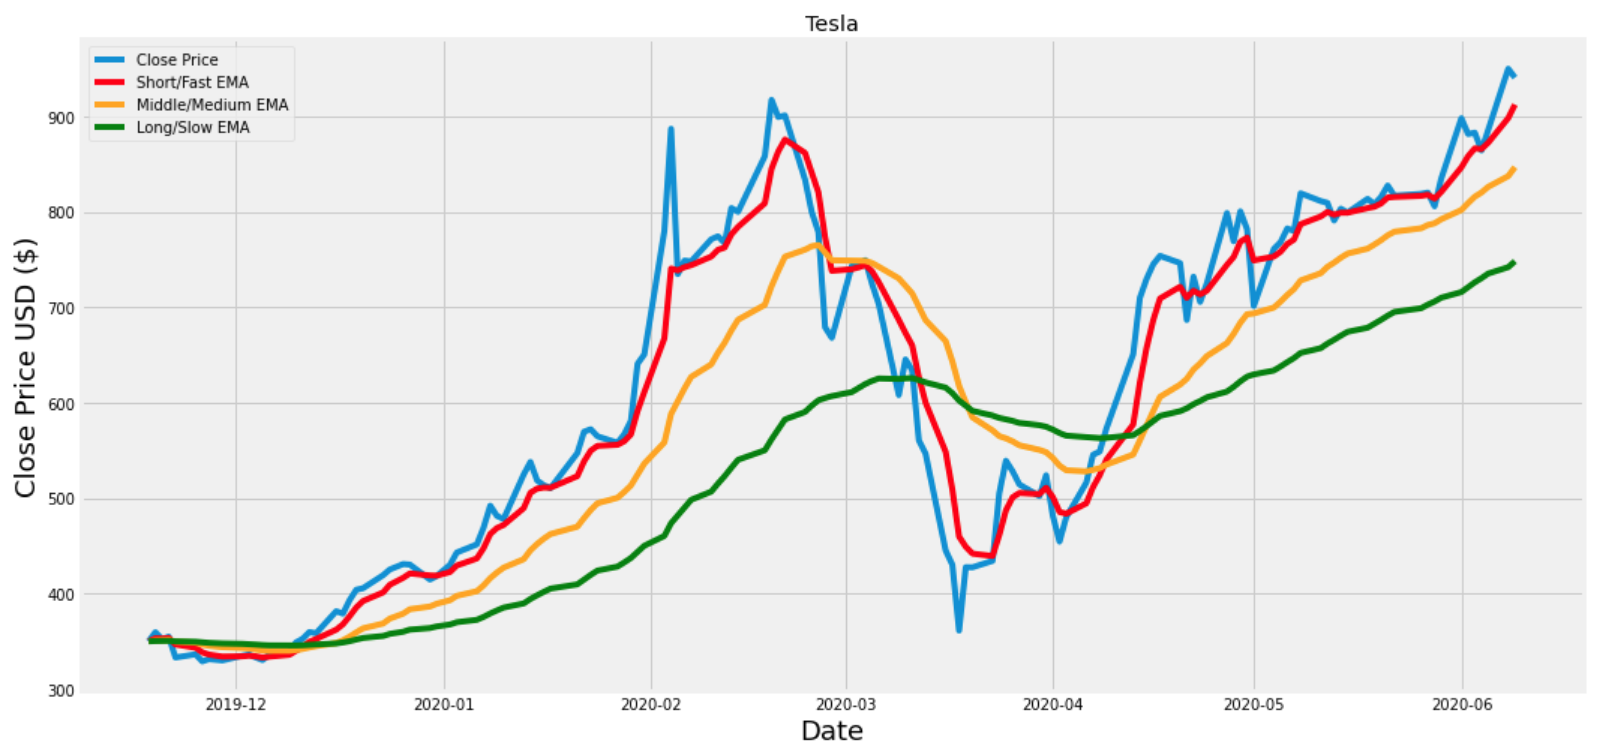
Calculate the three exponential moving averages.
**#Calculate the Short/Fast Exponential Moving Average**
ShortEMA = df.Close.ewm(span=5, adjust=False).mean() #AKA Fast moving average
**#Calculate the Middle Exponential Moving Average**
MiddleEMA = df.Close.ewm(span=21, adjust=False).mean() #AKA Slow moving average
**#Calculate the Long/Slow Exponential Moving Average**
LongEMA = df.Close.ewm(span=63, adjust=False).mean() #AKA Slow moving average
Visually show the closing price and the exponential moving averages.
**#Visualize the closing price and the exponential moving averages**
plt.figure(figsize=(16,8))
plt.title('Tesla')
plt.plot(df['Close'], label = 'Close Price')
plt.plot(ShortEMA, label='Short/Fast EMA', color = 'red')
plt.plot(MiddleEMA, label='Middle/Medium EMA', color = 'orange')
plt.plot(LongEMA, label='Long/Slow EMA', color = 'green')
plt.xlabel('Date',fontsize=18)
plt.ylabel('Close Price USD ($)',fontsize=18)
plt.legend(loc='upper left')
plt.show()
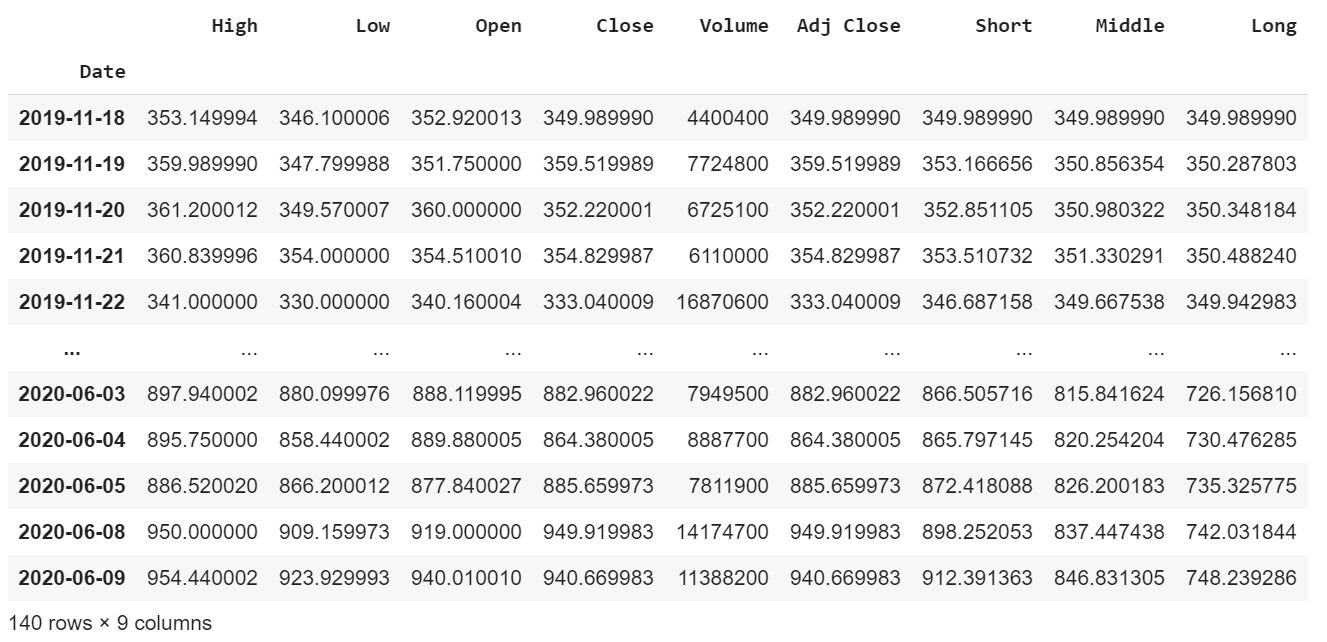
Add the exponential moving averages to the data set and show the new data.
**#Add the exponential moving averages to the data set**
df['Short'] = ShortEMA
df['Middle'] = MiddleEMA
df['Long'] = LongEMA

**#Show the data **
df
Create a function to execute the strategy to determine when to buy and sell the stock.
**#Create a function to buy and sell the stock (The trading strategy)**
def buy_sell_function(data):
  buy_list = []
  sell_list = []
  flag_long = False
  flag_short = False

for i in range(0,len(data)):
    if data['Middle'][i] < data['Long'][i] and data['Middle'][i] > data['Short'][i] and flag_long == False and flag_short == False:
        buy_list.append(data['Close'][i])
        sell_list.append(np.nan)
        flag_short = True
    elif data['Middle'][i] > data['Long'][i] and data['Middle'][i] < data['Short'][i] and flag_short == False and flag_long == False:
        buy_list.append(data['Close'][i])
        sell_list.append(np.nan)
        flag_long = True
    elif flag_short == True and data['Short'][i] > data['Middle'][i]:
        sell_list.append(data['Close'][i])
        buy_list.append(np.nan)
        flag_short = False
    elif flag_long == True and data['Short'][i] < data['Middle'][i]:
        sell_list.append(data['Close'][i])
        buy_list.append(np.nan)
        flag_long = False
    else:
        buy_list.append(np.nan)
        sell_list.append(np.nan)

return (buy_list, sell_list)
Next add the buy and sell signals to the data set.
**#Add the Buy and Sell signals to the data set**
df['Buy'] = buy_sell_function(df)[0]
df['Sell'] =buy_sell_function(df)[1]
Visually show the stock buy and sell signals.
**# Visually Show The Stock buy and sell signals**

**#Create and plot the graph**
plt.figure(figsize=(12.2,4.5)) #width = 12.2in, height = 4.5
plt.scatter(df.index, df['Buy'], color = 'green', label='Buy Signal', marker = '^', alpha = 1)
plt.scatter(df.index, df['Sell'], color = 'red', label='Sell Signal', marker = 'v', alpha = 1)
plt.plot(ShortEMA, label='Short/Fast EMA', color = 'red', alpha = 0.35)
plt.plot(MiddleEMA, label='Middle/Medium EMA', color = 'orange', alpha = 0.35)
plt.plot(LongEMA, label='Long/Slow EMA', color = 'green', alpha = 0.35)
plt.plot( df['Close'],  label='Close Price', alpha = 0.35)#plt.plot( X-Axis , Y-Axis, line_width, alpha_for_blending,  label)
plt.xticks(rotation=45)
plt.title('Close Price History Buy / Sell Signals')
plt.xlabel('Date',fontsize=18)
plt.ylabel('Close Price USD ($)',fontsize=18)
plt.legend( loc='upper left')
plt.show()
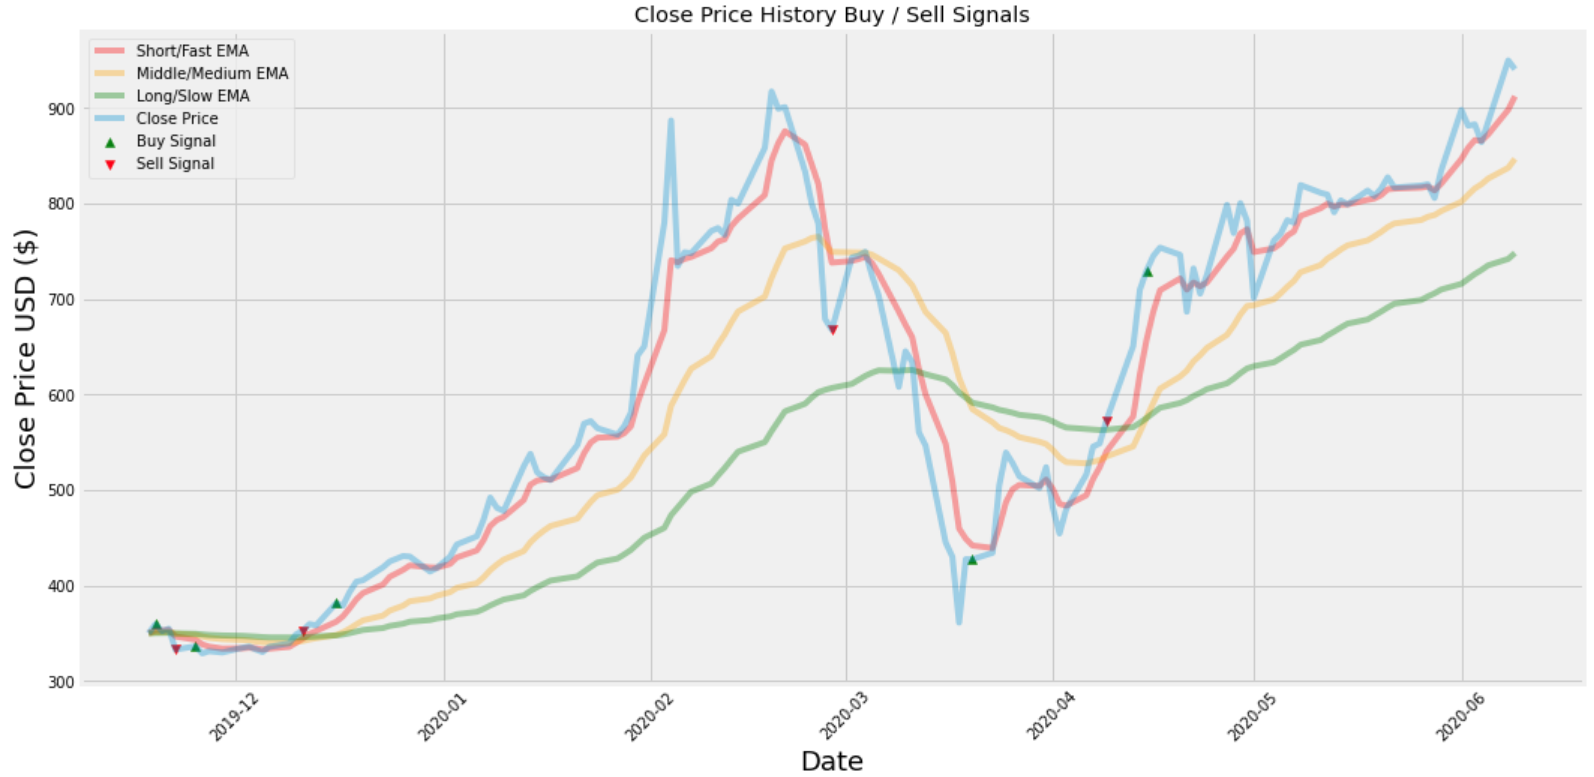
By using this strategy it looks like I would’ve lost money once, by buying the stock between the price of $350 and $400 and then selling it at a price between $300 and about $340.
However I would’ve profited about 3 times by buying the stock at around $340 before December 2019 and selling it for about $350 soon after between the dates December 2019 and January 2020. Then I would’ve bought the stock between that same time period for a little under $400 and later sold it right before March 2020 for a little under $700. That would’ve been a nice profit ! Next I would’ve bought the stock for around $450 between the dates March 2020 and April 2020 and sold it between the dates April 2020 and May 2020 for a little under $600.
In conclusion, this looks like a promising strategy, but I only used 140 trading days to test it and only tested it on one asset. Much more testing is needed before a strategy like this should be implemented.
If you want to start an investment portfolio, then sign up with WeBull using this link and get FREE stocks for depositing $100 or more. It’s free stocks that you can either sell, play with or create your own trading strategy with. I think it’s a great deal for a limited time and FREE money!
Thanks for reading this article I hope it was entertaining to you all! If you enjoyed this article and found it helpful please leave some claps to show your appreciation. If you aren’t a member of Medium already, then consider becoming a member if not for my articles then for all of the other amazing articles & authors on this site. You can easily become a member of Medium by using the link here. Keep up the learning, and if you like finance, computer science, or programming please visit and subscribe to my YouTube channels (randerson112358 & computer science).
Resources:
Three Moving Average Crossover
Comments
Loading comments…