
Photo by Lorenzo Lamonica on Unsplash
Decision Trees are machine learning methods for constructing prediction models from data. The prediction models are constructed by recursively partitioning a data set and fitting a simple model to each partition. As a result, the partitioning can be represented graphically as a decision tree.
Decision Tree consists of:
- Root Node : First node in the decision tree.
- Nodes : Test for the value of a certain attribute & splits into further sub-nodes.
- Edges/ Branch : Correspond to the outcome of a test and connect to the next node or leaf.
- Leaf nodes : Terminal nodes that predict the outcome.
Types of Decision Tree:
Classification Tree : The target variable is a categorical variable.
Regression Tree: The target variable is a continuous variable.
To understand the concept of a Decision Tree, consider the below example.
Let's say on a particular day we want to play tennis, say Monday. How do you know whether or not to play? Let's say you go out to check whether it's cold or hot, check the pace of wind and humidity, what the weather is like, i.e., sunny, snowy, or rainy. To decide whether you want to play or not, you take into consideration all these variables.
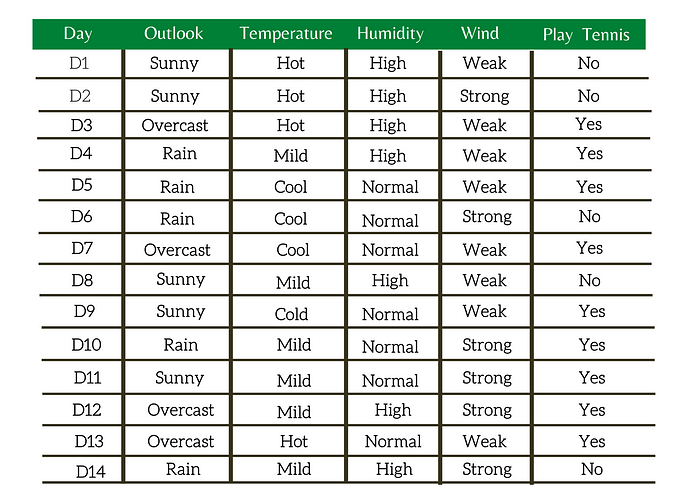
Table 1: Weather Data: Play or not Play?
Now, to determine whether to play or not, you will use the table. What if Monday's weather pattern doesn't follow all of the rows in the chart? Maybe that's a concern. A decision tree can be a perfect way to represent data like this. When adopting a tree-like structure, it considers all possible directions that can lead to the final decision by following a tree-like structure.
This article will demonstrate how to find entropy and information gain while drawing the Decision Tree.
Why Entropy and Information Gain?
The first question that comes to our mind while drawing a Decision Tree.
Given a set of data, and we want to draw a Decision Tree, the very first thing that we need to consider is how many attributes are there and what the target class is, whether binary or multi-valued classification.
In the Weather dataset, we have four attributes(outlook, temperature, humidity, wind). From these four attributes, we have to select the root node. Once we choose one particular feature as the root note, which is the following attribute, we should choose as the next level root and so on. That is the first question we need to answer.
So to answer the particular question, we need to calculate the Information Gain of every attribute. Once we calculate the Information Gain of every attribute, we can decide which attribute has maximum importance. We can select that attribute as the Root Node.
If we want to calculate the Information Gain, the first thing we need to calculate is entropy. So given the entropy, we can calculate the Information Gain. Given the Information Gain, we can select a particular attribute as the root node.
Everything You Need To Know About A Data Scientist
What is Entropy?
Entropy measures homogeneity of examples.
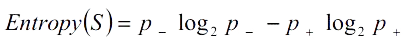
Defined over a collection of training data, S, with a Boolean target concept, the entropy of S is defined as
where
S is a sample of training examples,
p₊ is the proportion of positive example in S,
p_ is the proportion of negative examples in S.
How to calculate Entropy?
Entropy([14+, 0-]) = -14/14 log₂(14/14) — 0log₂(0)=0.
Entropy([7+, 7-]) = -7/14 log₂(7/14) — 7/14log₂(7/14)=1.
Entropy([9+, 5-]) = -9/14 log₂(9/14) — 5/14log2(5/14)=0.94.
Important Characteristics of Entropy
- Only positive examples, or only negative examples, Entropy=0.
- Equal number of positive & negative example, Entropy=1.
- Combination of positive & negative example, use Formula.
I hope you have learned how to calculate the entropy for a given data.
Now, we will try to understand how to calculate the Information Gain.
Information Gain
Information gain is a measure of the effectiveness of an attribute in classifying the training data.
Given entropy as a measure of the impurity in a collection of training examples, the information gain is simply the expected reduction in entropy caused by partitioning the samples according to an attribute.
More precisely, the information gain, Gain(S, A) of an attribute A, relative to a collection of example S, is defined as

where
S — a collection of examples,
A — an attribute,
Values(A) — possible value of attribute A,
Sᵥ — the subset of S for which attribute A has a value v.
How to find Information Gain?
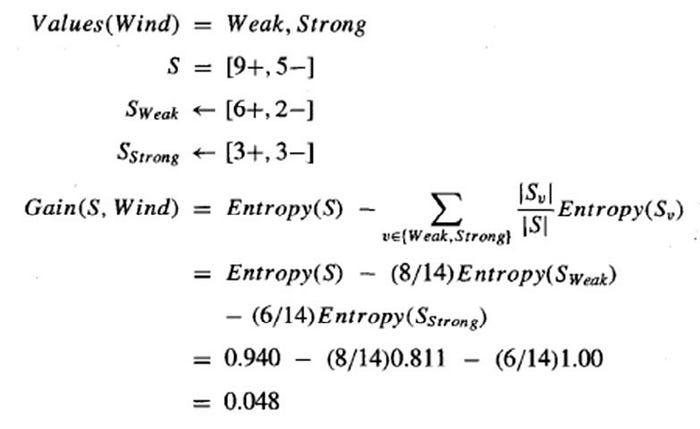
We will consider the Weather dataset in Table 1. There are four attributes(outlook, temperature, humidity & wind) in the dataset, and we need to calculate information gain of all the four attributes.
Here, I will illustrate how to calculate the information gain of wind.
In the weather dataset, we only have two classes , Weak and Strong. There are a total of 15 data points in our dataset with 9 belonging to the positive class and 5 belonging to the negative class.
The entropy here is approximately 0.048.
This is how, we can calculate the information gain.
Once we have calculated the information gain of every attribute, we can decide which attribute has the maximum importance and then we can select that particular attribute as the root node. We can then start building the decision tree.
If you found this article helpful, then feel free to send it to someone else. Thank you for reading.
Comments
Loading comments…