In Machine Learning world model performance is everything. There are several metrics using which we will be able to evaluate our model.
Confusion matrix is one such important tool which helps us evaluate our model's performance. As the name suggests it is a matrix of size n x n .where 'n' is the number of class labels in our problem.
Now, let's take a look at confusion matrix structure. Here,I am showing the python standard matrix notation for two class classification.
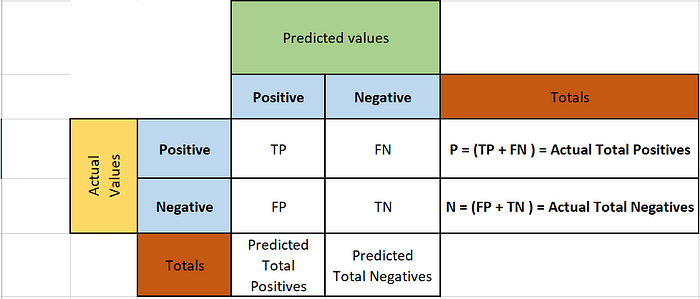
Python's Representation of Confusion Matrix
In Python's implementation of confusion matrix, rows show actual values and columns indicate predicted values. Given below is the description of each cell.
TP (True Positives):
Actual positives in the data, which have been correctly predicted as positive by our model. Hence True Positive.
TN (True Negatives):
Actual Negatives in the data, which have been correctly predicted as negative by our model. Hence True negative.
FP (False Positives):
Actual Negatives in data, but our model has predicted them as Positive. Hence False Positive.
FN (False Negatives):
Actual Positives in data, but our model has predicted them as Negative. Hence False Negative.
Apart from this, by looking at confusion matrix we can get two more insights. Which are Totals of predicted and actual values.
It all looks, good. But how to remember it? There is a trick I have learnt from someone.
Rows are always actual and columns are predictions. This is the base rule.
Once we set that base rule, first cell is TP. Diagonal to it is TN.
Once we set TP and TN, come to the row where we have TP. Next to it comes the opposite of T and opposite of P. So, opposite of T is F and opposite of P is N. So, we put FN next to it.
Similarly in the second row, where we have TN, we put opposite of it in the next cell. So, we put FP.
I feel it is a bit convenient to remember. If it is not. I am sorry :(
Now, we know how to read Confusion Matrix. Now, let's see what are some metrics we can derive from this.
In ML, We have so many metrics. Out of which most known and used one is Accuracy.
Accuracy:
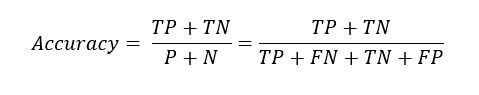
Accuracy formula
Accuracy tells the percentage of correctly predicted values out of all the data points. Often times, it may not be the accurate metric for our model performance. Specifically, when our data set is imbalanced. Let's assume I have a data set with 100 points, in which 95 are positive and 5 are negative.
And, if I have a very dirty model, which always predicts output as positive irrespective of the input. If we apply that model on our data it gives all 100 points as positive. Out of which 95 are true positives and 5 are false positives.
Now, if we calculate accuracy of our model using above formula.
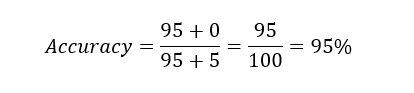
We got whopping 95% accuracy.To the naked eye it looks amazing. But what exactly has happened? Our model failed to identify negative labels. Since positive points in our data set or more we got more accuracy.
When we have this kind of scenario accuracy is not a good metric to evaluate our model. Certain models need to identify positive cases more accurately, certain cases need to identify negative cases more accurately.
Assume a hypothetical model which detects cancer. Assuming that our test data has more patients who are cancer negative and less patients who are cancer positive, which generally will be the case. Our model needs to identify negative more accurately than Positive.
Because, even if we give false positive, patient can get him checked one more time using other tests to confirm if he is really positive or not. But, we can't afford to have false negatives. Because, if he is really positive and model predicted him as negative, patient may never know that he has cancer.
So, we understood that accuracy is not always the best metric and different models will have different metrics based on business case. Let's see some of these metrics and how to remember them.
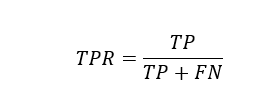
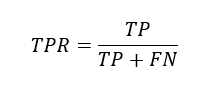
TPR (True Positive Rate) or Recall:
TPR formula
It tells us, out of all the positive data points, how many have been truly identified as positive by our model.
How to remember this formula? Go to confusion matrix image and take a look again.
TPR is TP divided by the values of the row in which TP is present. Attaching image again here for quick look.

Easy way to remember TPR formula
We use same approach to remember all the below formulas.
TNR (True Negative Rate):
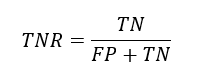
TNR formula
It tells us, out of all the negative points in our data set, how many have been truly identified as negative by our model.
FPR (False Positive Rate):
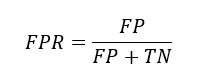
FPR formula
It tells us, out of all the Negative points, how many have been falsely identified as positive by our model.
FNR (False negative Rate):
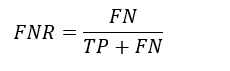
FNR formula
It tells us, out of all the positive points, how many have been falsely identified as negative by our model.
If you look carefully, we can remember all these formulas using the technique given in TPR. All of them follow same rule.
Apart from these, there is another one which is widely used.
Precision:
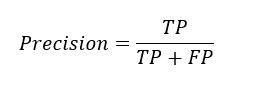
Precision formula
It tells use, out of all the points which have been identified as positive by our model, how many are actually true.
So, when to use which is the question of the hour.
Again consider our cancer detection model. Here we cannot afford to have false negatives. So, we should take the metric which have FN in the denominator and our model should give higher values for that metric.
For example, take Recall or TPR, which is
If we have less value in FN, TPR value increases. If we have 0 in FN value TPR will be equal to 1 which would be our ideal scenario. So, for our cancer detection model recall should be more.
Similarly, we have fraud detection system, where fraud is considered as positive and not fraud is negative. Here, we need to be absolutely sure when we say it is fraud. We cannot afford to have false positives. In this case, we use TNR as a metric and it should be as high as possible, which has FP in the denominator or else we can use FPR and it should be less. We can use precision also which gives us actual positives out of all the positives in the data.
Out of all the above given metrics recall, precision and accuracy are the metrics most widely used.
Now, we understood how to read confusion matrix and how to derive all the above mentioned formulas from it.But, we looked at only two class classification. What if we have more than one class? How to read that confusion matrix.
For this, let's take Iris — Dataset . You can find this here.
I have applied KNN- classifier on this data set and want to see confusion matrix of the test data set.
Iris data set has 150 data points in total and three labels each label has 50 points.
Out of which I trained the model using 100 data points and tested using 50 data points.
Here is the confusion matrix generated by Python using predicted vs test data set.
iPython note book can be found here.
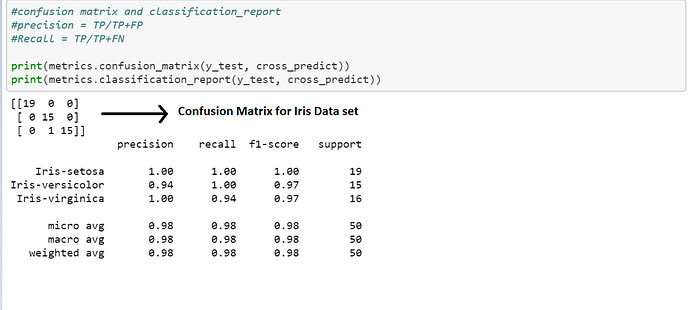
Confusion matrix for Iris Data set on KNN -Classifier
I am putting the confusion matrix in spread sheet for better understanding.
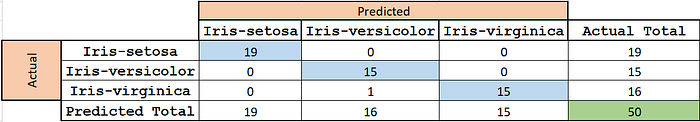
Confusion Matrix from above Python code
In the above image, cells highlighted in light blue are true positives for that respective class label in that row. If we observe carefully,all the highlighted cells have same label in row and column. Other cells in that row are false negatives for the label .For Iris-Setosa row, whatever is shown in highlighted cell is true positive for Setosa and the values in other cells in the same row are false negatives for Setosa. This is similar to the understanding we had in two class classification example given above.
For example, Iris-Setosa has 19 in the cell highlighted in blue. Which means out of the labels which have been identified as Setosa by our model 19 are truly Setosa and we do not have any false negatives which means none of the Setosa has been falsely identified as either Versicolor or Virginica.
The last column in actual row is, how many Setosa are there actually in our data set. We have 19 Setosa in our data set. So, our model has correctly identified all the Setosa. Predicted Total of Setosa is also 19 which is matching with actual. This is good.
Now look at Versicolor row. Setosa column has 0 which means none of the Versicolr has been falsely identified as Setosa. Versicolor column has 15 which means 15 Versicolor have been truly identified as Versicolor. Virginica column has 0 whicch means none of the Versicolor has been falsely identified as Virginica . Actual total of Versicolor is 15, but it is not matching with predicted total of Versicolor which is 16.This indicates that our model has identified something else also as Versicolor. We will not know this by looking at this row, Because this will have information about True positive and False Negative for Versicolor.
What exactly has happened? we got a false positive for Versicolor. Which means it must be a false negative for some other label. We already saw that Setosa has no false negatives.So, it must be Virginica.
Now, look at Virginica row, Setosa column has 0, this indicates that none of the Virginica has been falsely identified as Setosa. Versicolor column has 1, which means 1 of the Virginica has been falsely identified as Versicolor .This a false negative for Virginica. Virginica column has 15, this tells us that 15 Virginica have been correctly identified. But, here also actual total and predicted total are not matching. Actual is 16 and predicted is 15 .That means we have a false negative in Virginica label.
If we take a look at precision and recall score. Setosa has 100% score. Because none of the Setosa has been classified as some other species. Similarly none of the other species has been miss-classified as Setosa. So, we got 100% precision and 100% recall. Because both FP and FN are 0.
For Versicolor, recall is 100%.Because there is no false negative. But, Precision is less because of false positive.
For, Virginica, precision is 100%.Because there is no false positive. But recall is less because of false negative.
Overall average accuracy is 98%.
I think this article gave an intuitive understanding of confusion matrix and different performance metrics used in ML. Thank you for reading.
Comments
Loading comments…