As a developer, you probably spend a lot of time learning and testing code, hacking API or dataset, writing documentation, both for yourself or your teammates.
In this article, I'll show you how to use Znote to quickly prototype code or perform data exploration. Strongly inspired from the awesome Jupyter project, Znote try to give a similar experience dedicated to the JavaScript ecosystem.
What is Znote?
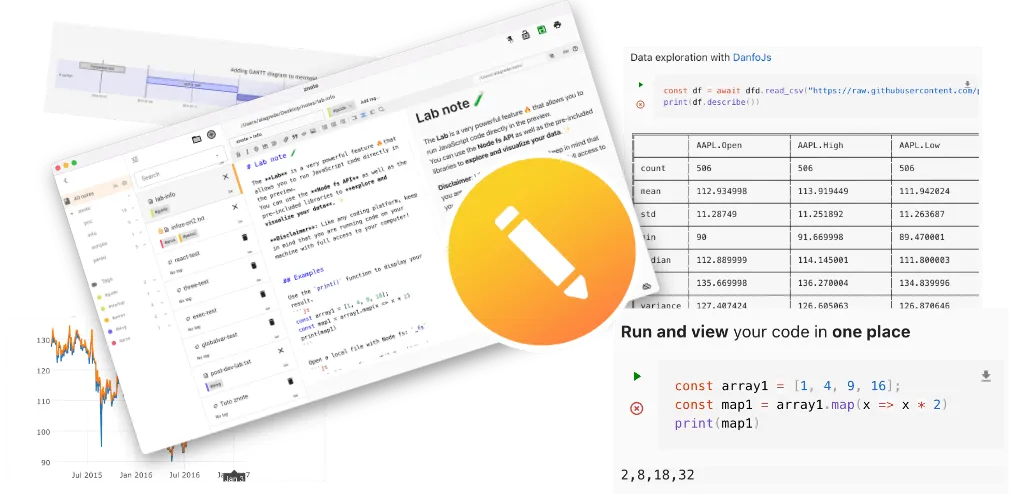
The Znote is a powerful tool for interactively developing/presenting data or prototyping scripts.
A note integrates code and its output into a document that combines visualizations, charts, narrative text and other media. Additionally, you can organize your work to quickly access to your notes and thoughts.
JS Playground for prototyping
The JS Playground is fully integrated with the Markdown syntax. Just create a standard JavaScript code block to start executing your code.
To speed up this action, you can use the keyboard shortcut Cmd+P

Note: Code blocks are async and support the latest JavaScript ES6--7 syntax. So you can
directly await for an asynchronous function. Errors are automatically caught and displayed in the
output.
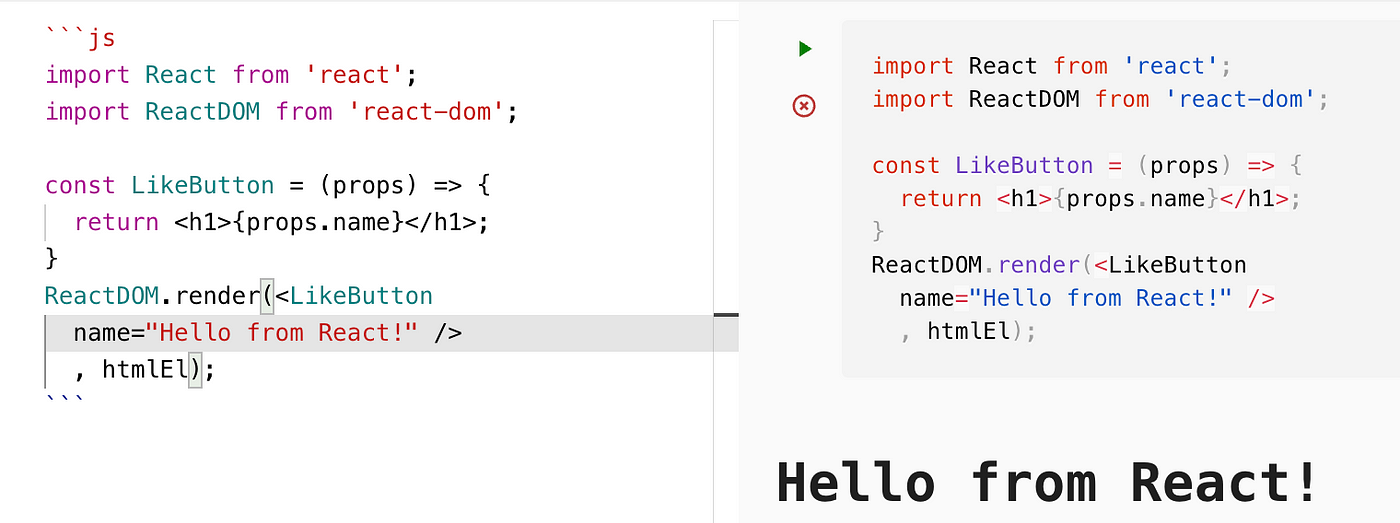
Because the preview is a local browser, you can import and run any JS UI libraries like React - Yes, JSX is also supported!
It's also possible to mix Node.js libs with the require() keyword, or run a plain Node.js code.
Others Node API are also available like fs or exec to easily interact with your local system.
The possibilities are endless.
Full documentation here.
Data exploration
Znote comes with 2 awesome libraries pre-included to help you perform efficient data exploration: DanfoJS and PlotlyJS
Danfo.js is heavily inspired by the Pandas library and provides a similar interface and API. This means users familiar with the Pandas API can easily use Danfo.js.
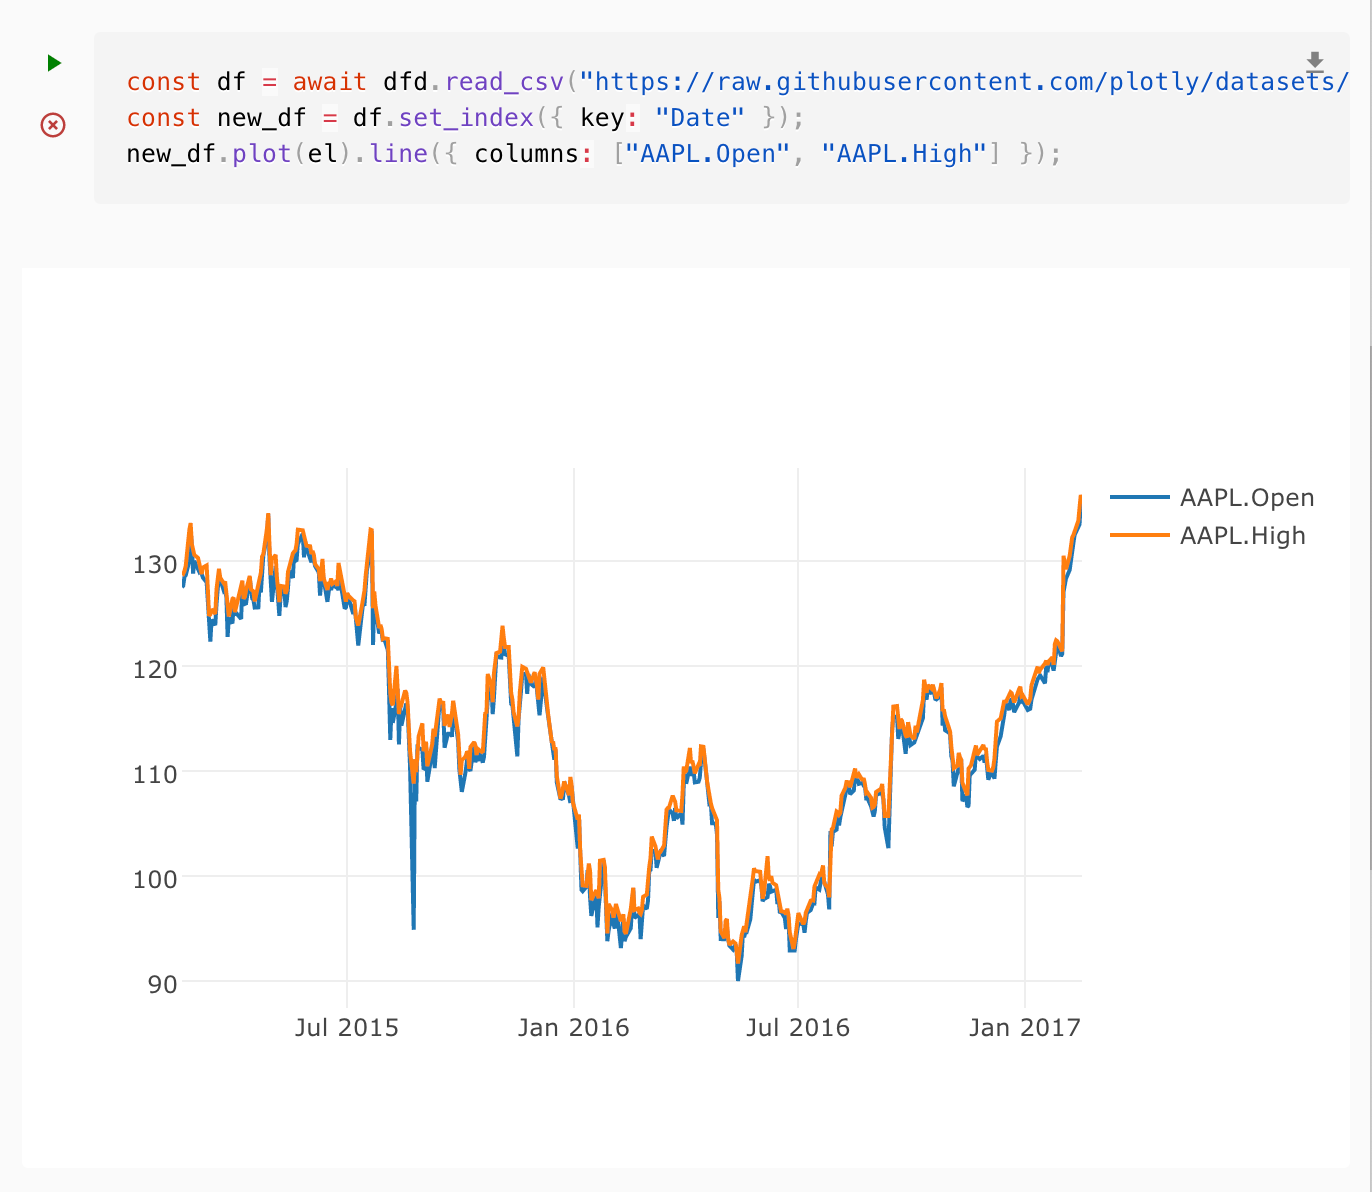
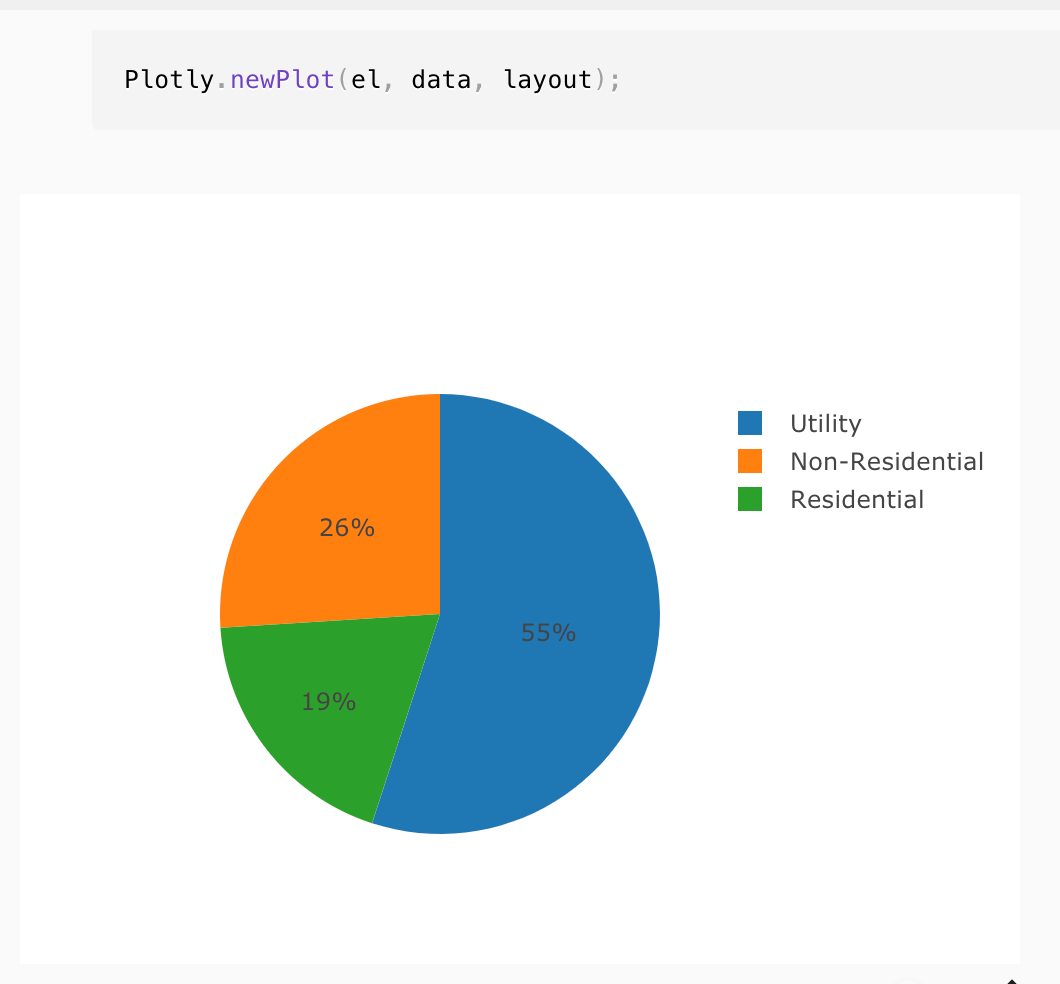
PlotlyJS is Built on top of d3.js and stack.gl, Plotly.js is a high-level, declarative charting library. plotly.js ships with over 40 chart types, including 3D charts, statistical graphs, and SVG maps.
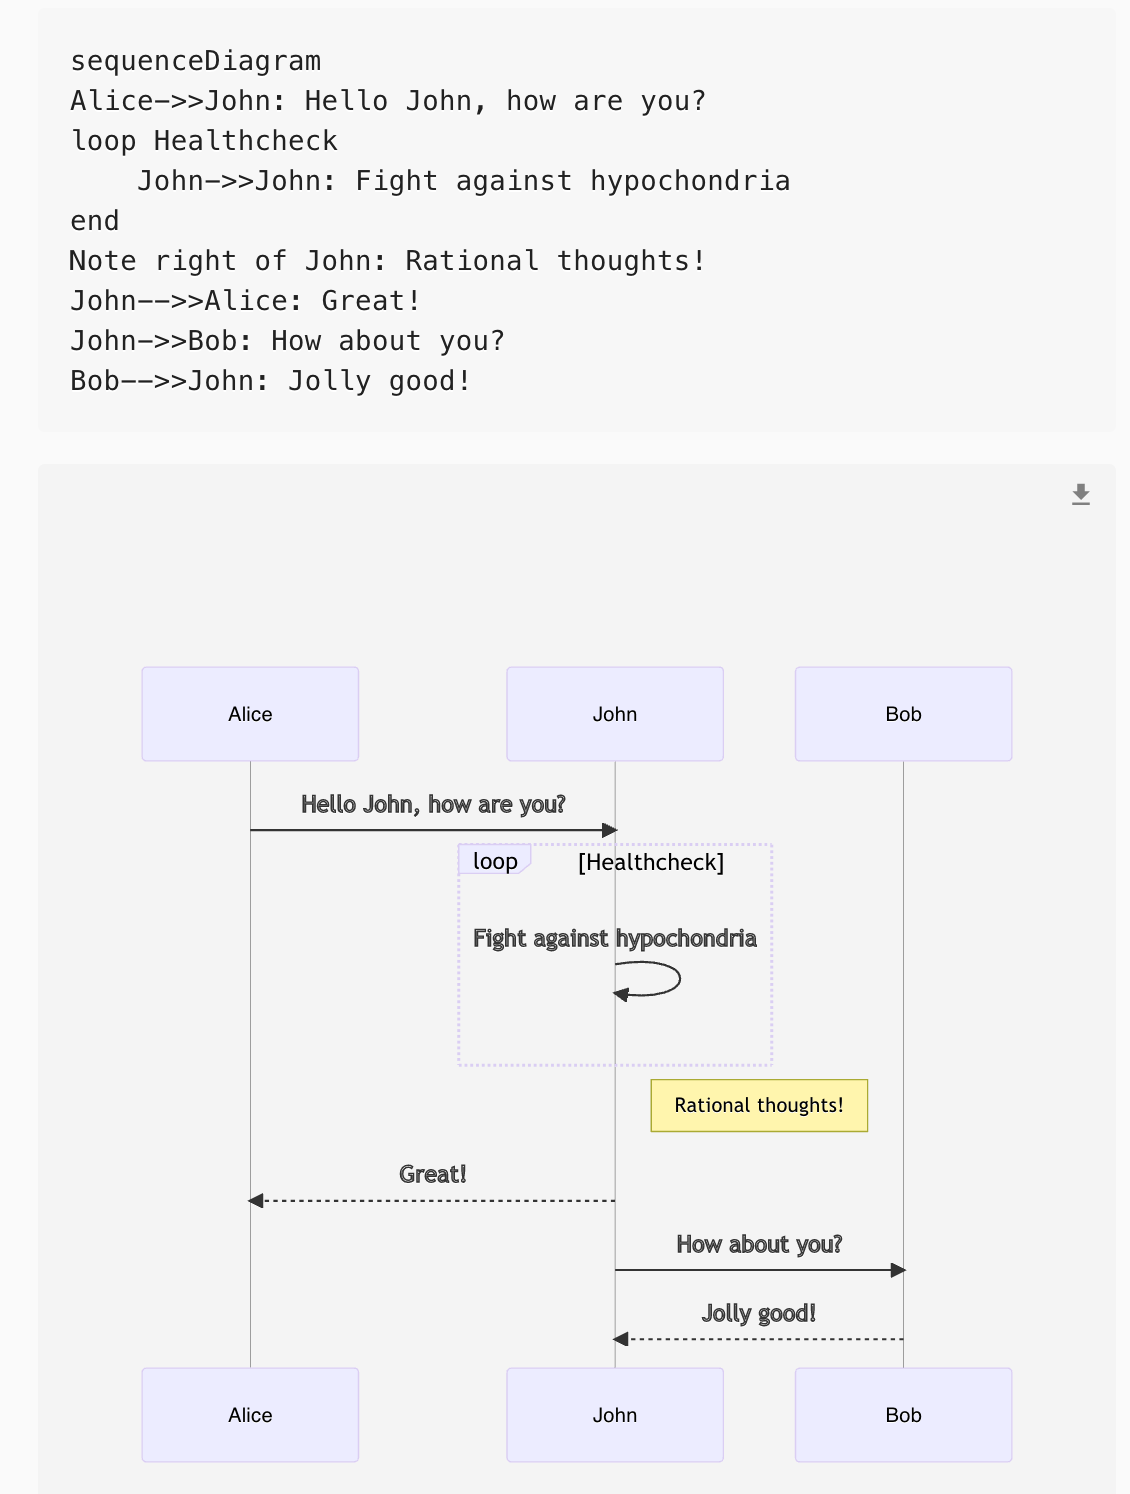
Diagrams
Thanks to the Mermaid integration you can create diagrams and visualizations using text and code.
Dynamic Markdown
Because interacting with text is important too, Znote provides plenty of dynamic helpers and adaptive completion to help you write quality documentation.
This is just the beginning! Znote contains a bunch of useful features that will help you be more efficient in your daily work.🧑💻
And now? It's already available!
You can visit the website to get the app here: https://znote.io/
The complete product documentation is available online https://doc.notebookjs.app/
Hope you will enjoy using this app and it will make your job a little more fun.
Further Reading: How to Write Markdown: A Beginner's Guide
Comments
Loading comments…