
1. victory
GitHub Stars: 9.2K

A great choice for implementing graphs and charts in React applications, you get awesome features such as brush & zoom. However, achieving decent chart results takes more time & it is recommended to use this library only if you are working on a personal project as it is easy to use when compared to others.
-
It comes with a limited number of visualizing tools, however, it is easier to use but lacks while controlling _label positioning, width _&_ height_.
-
You can also work with charts and graphs in React Native using this library, also its is considered a good choice because it doesn't directly interact with the DOM like other libraries.
2. kepler.gl
GitHub Stars: 8.3K

A powerful library for large-scale data sets, built on top of deck.gl it can render millions of points. As a React component, it uses Redux to manage its state and data flow, which gives the flexibility to customized like any other Redux state. To work with kepler.gl you simply have to mount the kepler.gl React component in the UI and kepler.gl reducer in the root reducer.
-
This library is recommended to use in large-scale applications and personal projects as well as it is well maintained by the developers at Uber.
-
Using kepler.gl takes some time as compared to other data visualization libraries.
3. reaviz
GitHub Stars: 507

This library uses D3js under the hood for calculations, it provides all the basic charts that you may need in your applications. Multiple charts types are available with a good amount of customization options. In this list, this library is quite efficient with charts, also editing data in real-time is easy as compared to others.
-
Great Documentation.
-
Smooth with editing real-time data.
4. fusioncharts
GitHub Stars: 8.8K

One of my personal favorite chart libraries as a React Native developer, this library provides all the essential features with good documentation at our fingertips. Fusioncharts supports vast chart types & maps with easy integration to any tech stack. If you are working on a large-scale production application then I’ll recommend using this library, as the charts render like a charm even on low-performance devices.
-
A good choice for production-level Mobile & Web applications.
-
Provides good support with implementation assistance.
5. react-vis
GitHub Stars: 8.1K
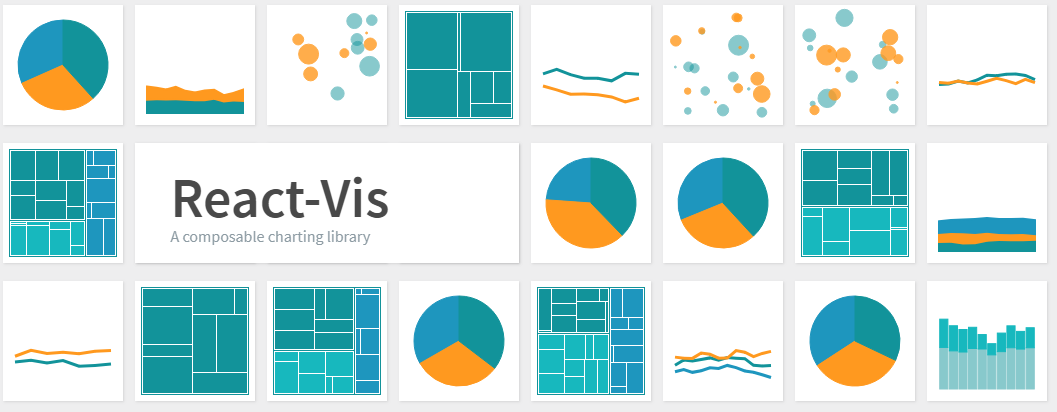
Another great library built by developers at Uber with some great features, react-vis is simple to use and flexible, beginners who are new to the React ecosystem can easily start building charts on Mobile & Web applications.
-
It is quite simple and you don't have to be super good at React as it doesn't require any deep knowledge of React libraries for your first visualization.
-
It also provides a set of basic building blocks which makes getting started easier._ For example_, separate X & Y components provide a high level of control on laying out charts.
-
It supports React’s lifecycle and doesn't create unnecessary nodes.
6. react-flow
GitHub Stars: 8.8K
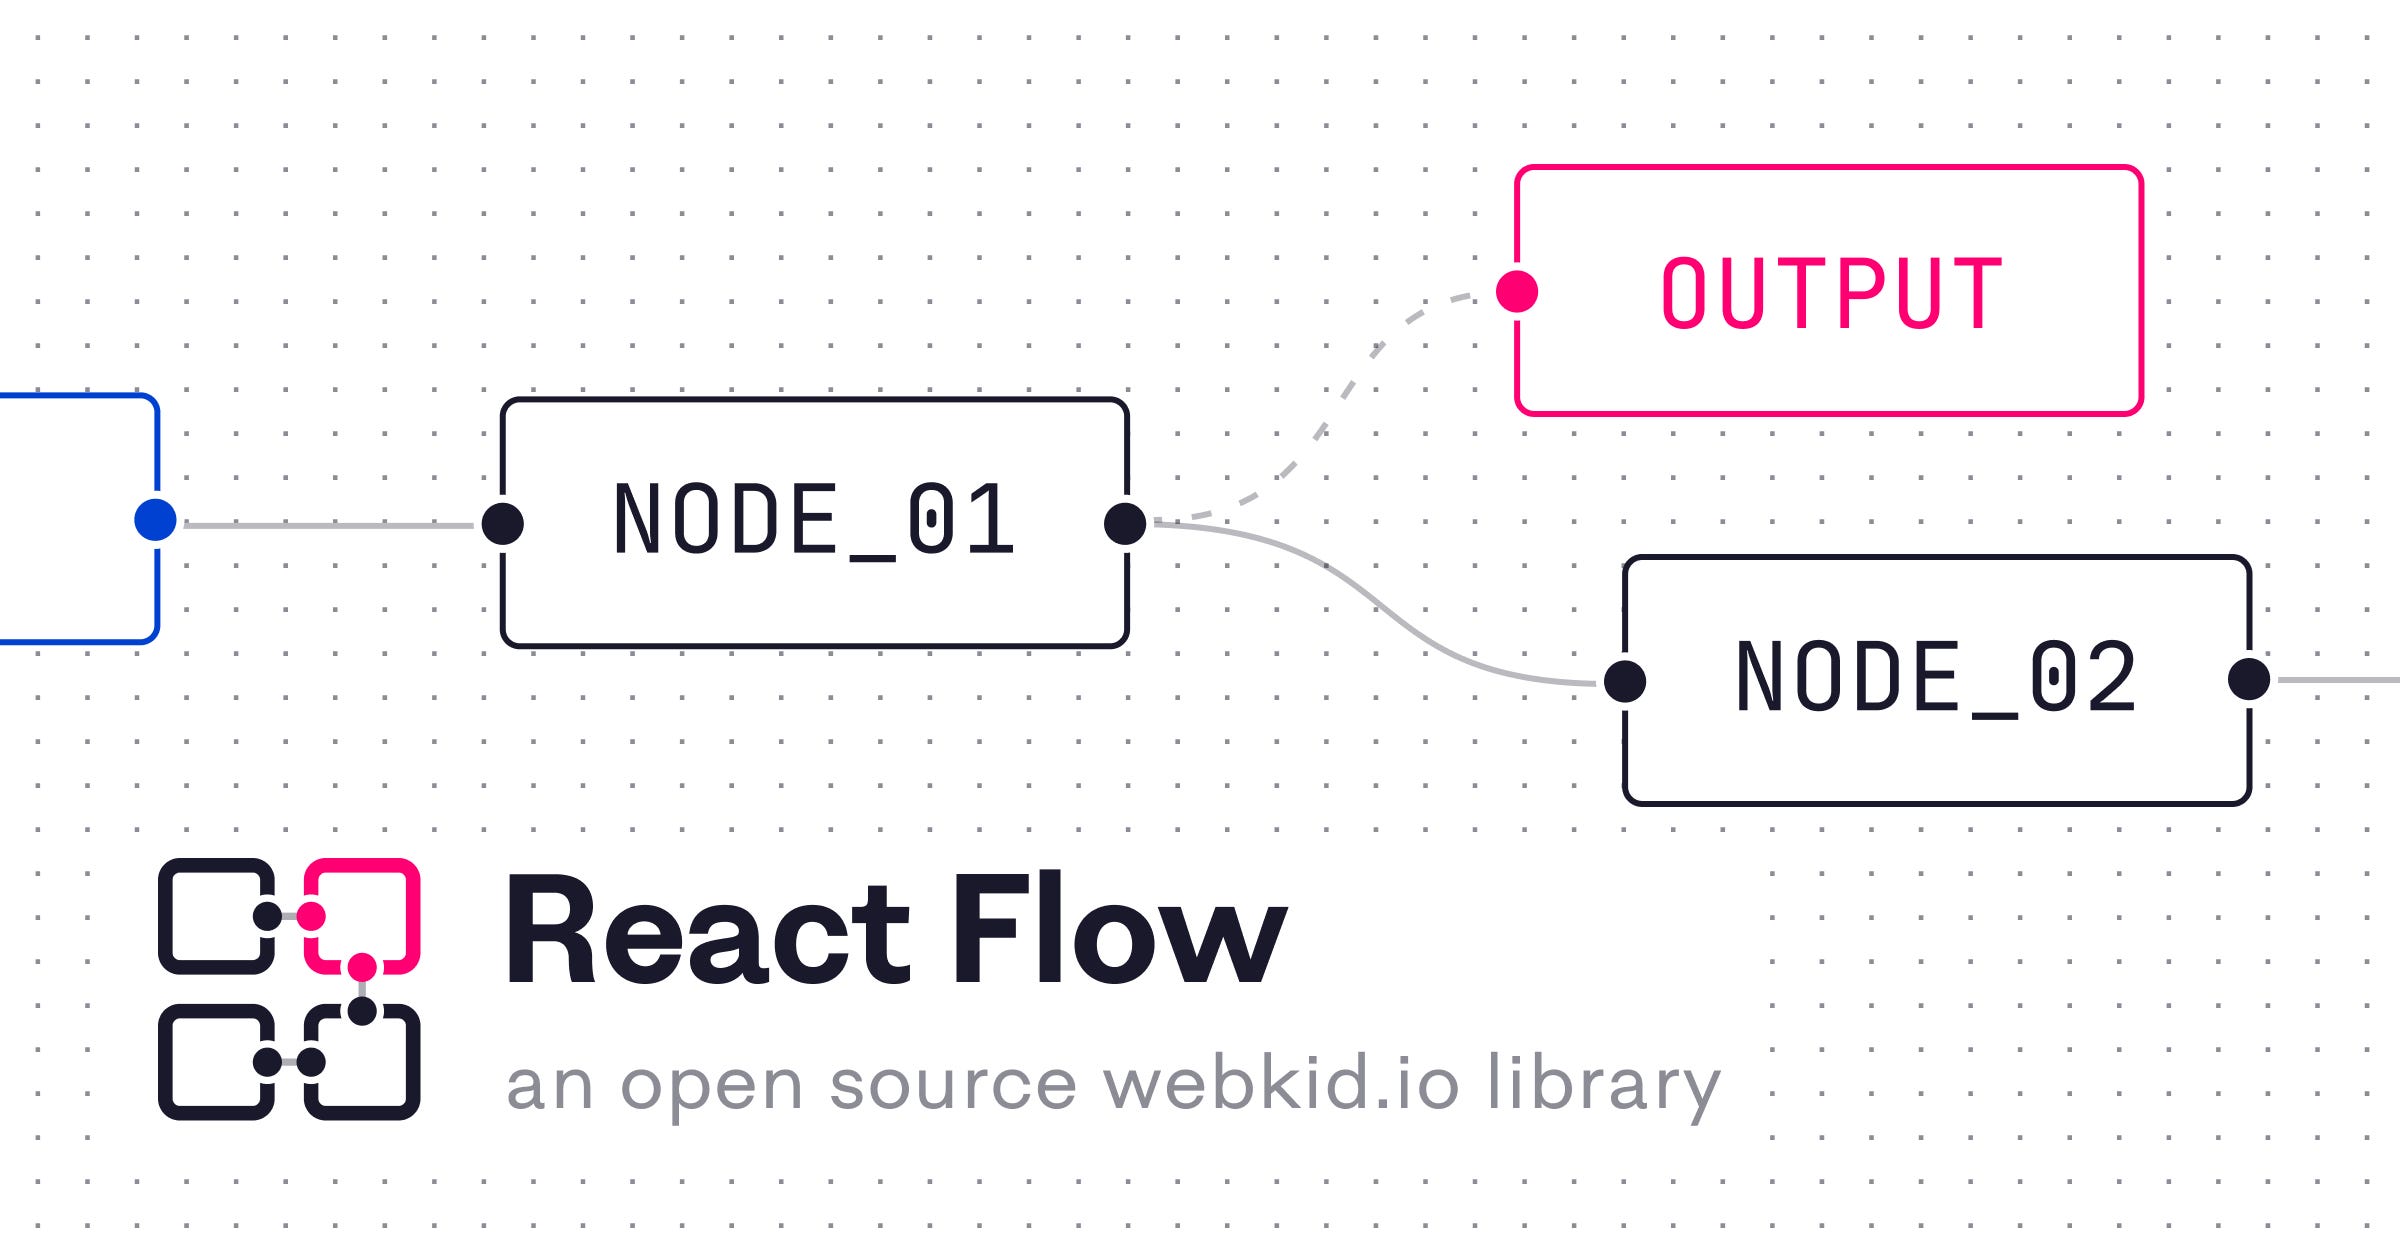
A quite interesting library where you can build node-based graphs in your React applications. It is easy to use with seamless zooming and panning features and a single multi-selection of elements.
While working with node-based graphs you get customizable nodes and edge types that render in no time even on low-performance devices. Also, it's written in TypeScript and tested with cypress.
- You can take a look at some examples** of how node-based graphs look in react-flow. 4 Skills That Never Get Old for Developers Skills To Level Up Your Confidencejavascript.plainenglish.io 5 Ways to Make Money as a Self-Taught Developer in 2022 Earn More Than A Full-Time Job in 2022javascript.plainenglish.io **Everything New in TypeScript 4.5 A Better Version of TypeScript is Finally Herejavascript.plainenglish.io
Comments
Loading comments…