
Welcome to the Creating a Web Map with Leaflet and Python tutorial. In this tutorial we will be building a simple world population map. Our scenario will be mapping the world population for the year 2015, using a point map. We will then serve our map on a local python server that we will build from scratch.
Let’s begin!
The following will be the tech stack that we will be using to build our web map:
Python3 — We will use Python3 to create our back-end server. It can be downloaded here.
Leaflet — We will use Leaflet as our mapping library and our front-end code. It can be downloaded here.
HTML5 — We will use this to create our web application.
Step 1: Create the project folder at the location of your choice
Step 2: Create the project files inside the folder
Create two files inside the project folder. One will be our map.html file, and the other will be our server.py file. The map.html file will contain our front-end code, and the server.py file will contain our back-end code.
Step 3: Create a simple html template
Here we will modify our map.html file. We want to create a standard HTML5 template, and test if our markup code works properly in our web browser. So let’s open our map.html file in a text editor of your choice, and add the following code:
<!DOCTYPE html>
<html>
  <head> </head>
  <body></body>
</html>
Next we will add a <title> tag inside our <head> tag, and then we will add an <h1> (heading) tag inside our <body> tag, and then test if we can display it on our web page.
We will call the title of the page World Population Map as seen below:
<head>
  <title>World Population Map</title>
</head>
And here we will just print heading in capital letters.
<body>
  <h1>HEADING</h1>
</body>
Here is the full code we have so far:
<!DOCTYPE html>
<html>
  <head>
    <title>World Population Map</title>
  </head>
  <body>
    <h1>HEADING</h1>
  </body>
</html>
Let us save it and double click the map.html file, in order to run it in our browser. I am using Google Chrome as my web browser.
What you should be seeing now is the title which says World Population Map and our heading below in all caps.
Now let us style our heading and change it’s color, just to see if our css and html code is working in our browser. We will be adding <style> tags inside of our tags, then we will add our styling code as follows:
<head>
  <title>World Population Map</title>
  <style>
    h1 {
      color: red;
      font-style: italic;
    }
  </style>
</head>
So we are targeting the h1 tag as an id, and we are styling all h1 tags to have a color red and to make the text italic.
The full code should now look as follows:
<!DOCTYPE html>
<html>
  <head>
    <title>World Population Map</title>
    <style>
      h1 {
        color: red;
        font-style: italic;
      }
    </style>
  </head>
  <body>
    <h1>HEADING</h1>
  </body>
</html>
Now let us save our code and refresh the web page, or double click the map.html file to see the changes made to our web page:
We should now see our styling applied. So now we can confirm that our html and css code is working successfully in our browser. We are now ready to start building our application.
Step 4: Create a Web Server for our application
So right now our web page is being rendered from our local file system, this is bad practice. The JavaScript code will not work, for security reasons not covered in this tutorial. JavaScript can only be run in the browser and on a web server.
To be able to execute JavaScript, we will need to create a web server. We need to be able to execute JavaScript, because we will be using a library called leaflet.js to create our maps, which is written in JavaScript code.
We will be using python’s SimpleHTTPServer module to create our web server. This module is a built in python3 module, so we shouldn’t need to install it.
Now let’s open the server.py file to add the following code for our server:
  import http.server
  import socketserverPORT = 8000
  handler = http.server.SimpleHTTPRequestHandlerwith
  socketserver.TCPServer(("", PORT), handler) as httpd:
    print("Server started at localhost:" + str(PORT))
    httpd.serve_forever()
In the above code, we first import the libraries we need to create our http server. Then we define a default port where our web server will be running at. Here we are using port 8000, you are welcome to use your own port number.
Then we create a handler class, where we will be able to handle incoming and outgoing requests to our web server.
Lastly we will run our server using the httpd.serve_forever() function. This will keep our server running and waiting for requests on port 8000, until we decide to manually kill it.
The next thing that we need to do now, is to run our server. But before we do that, there’s one thing to take note of. If we want to serve the html files from our server, we need to make sure that they are located in the same directory as our server.py file.
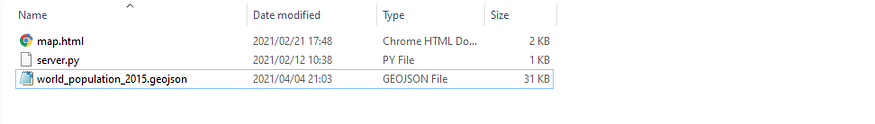
Now open the command-line terminal and locate the path where our server.py file is located at:
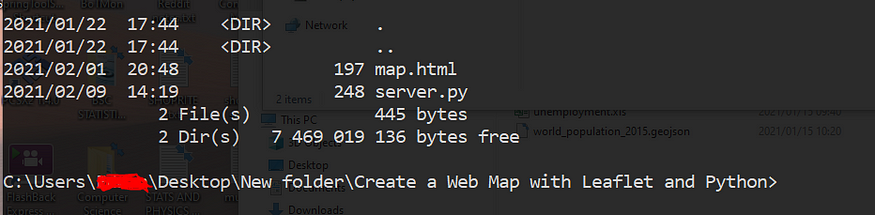
Now run the server.py file, with the command:
python server.py
You should see our printed message, telling us that the server is running at localhost:8000:

Now let’s verify that the server is working by entering the url: localhost:8000 in our web browser.
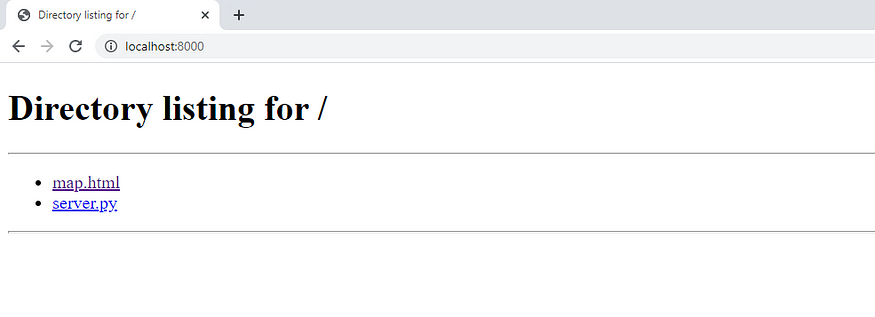
As you can see our server is working, and we can now also see our two files are located at the server url. We will now click on the map.html link and we should be able to view our html page on our web browser as we did before.
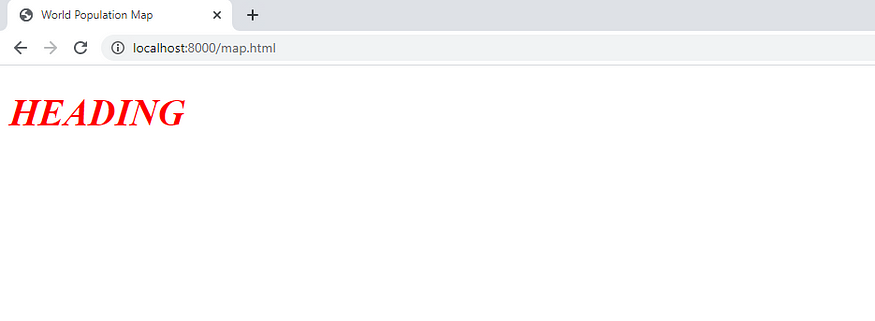
We can now see that the map.html file is served up by the server. Take note of the changes to the url link of the page as well (localhost:8000/map.html).
So now we see that our server is working, however we want a better way of serving our html page to the browser. We don’t want the server to list all the files in the directory, we want the correct html page to be displayed when we enter the url in the web browser. So we will be modifying our server.py code to fix this issue.
Step 5: Creating a Request Handler for our server
We will now create a request handler for our server, so that we can serve the appropriate web pages to the user. This will also allow us to get rid of the Directory Listing we saw in the previous step, when we entered the url in the browser.
We will make a few changes to the server.py code, it would be better to remove all the code that we currently have and start with an emtpy file, to avoid any confusion and syntax errors.
We start by importing our libraries:
    import http.server
    import socketserver
Next we will create requests handler class, to handle our incoming requests to the server, and serve the appropriate web page, which in our case will be to serve the map.html file. In other words, we want to automatically display the map.html application when the user enters the url (localhost:8000) into the web browser:
  class RequestsHandler(http.server.SimpleHTTPRequestHandler):
    """
    Handles http requests
    """
    def do_GET(self):
      if self.path == '/':
        self.path = 'map.html'
      return http.server.SimpleHTTPRequestHandler.do_GET(self)
So here we are handling a basic GET request, which means that the user has entered the url in the web browser, and will be getting back the map.html file and it’s contents displayed in the web browser.
Next we will create and object of the above class:
handler_object = RequestsHandler
Now the rest is as we have done in the old server.py code. We will create our server and specify our default port, where our server will be running at and we will run the server:
  PORT = 8000
  my_server = socketserver.TCPServer(("", PORT), handler_object)# Start the server
  print("Server started at localhost:" + str(PORT))
  my_server.serve_forever()
Note that we have parsed our request handler (handler_object) as a parameter and our port where the server will be running at.
So the entire code of our server.py file should now look like below:
import http.server
import socketserverclass RequestsHandler(http.server.SimpleHTTPRequestHandler):
  """
  Handles http requests
  """
  def do_GET(self):
    if self.path == '/':
      self.path = 'map.html'
    return http.server.SimpleHTTPRequestHandler.do_GET(self)# Create object of above class
handler_object = RequestsHandlerPORT = 8000
my_server = socketserver.TCPServer(("", PORT), handler_object)# Start the server
print("Server started at localhost:" + str(PORT))
my_server.serve_forever()
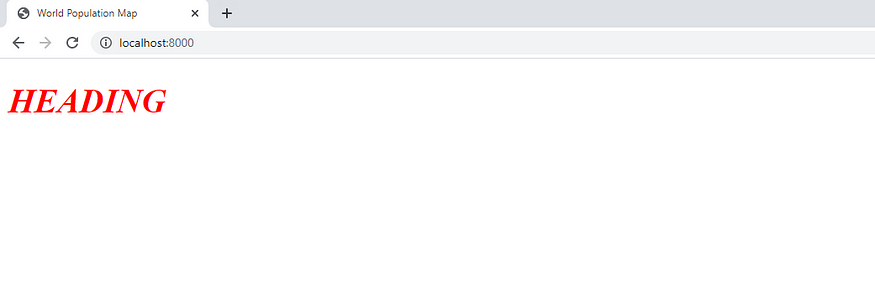
We can now save the code and run the server in our command line terminal as we have done before. But remember to first kill the old server with “Crtl C”. We will then enter the url (localhost:8000) into our web browser.
We should now be served our map.html application and Directory Listing should now be removed:
Step 6: Adding the leaflet.js library to our application
Now that we have created our server and we are able to serve our web pages, we can now start to create our map application.
We are now going to modify our map.html template and write our application code.
The first thing we need to do is add <meta> tags inside of our <head> tags, right above our <title> tags. These meta tags will allow our map application to automatically scale to fit almost any screen size on any device with a web browser:
<meta
  charset="utf-8"
/><!-- Tell the browser to be responsive to screen width -->
<meta
  content="width=device-width, initial-scale=1, maximum-scale=1, user-scalable=no"
  name="viewport"
/><meta http-equiv="x-ua-compatible" content="ie=edge" />
Next we will add the leaflet.js library to our application. Leaflet.js is the JavaScript library that we will use to build our maps, and any web gis application for that matter:
If you haven’t already visit the leaflet website and locate the downloads page:
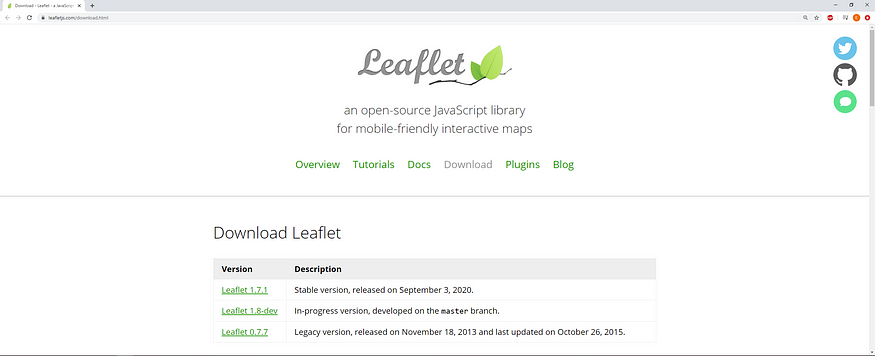
Now scroll down, until you see the heading: Using a Hosted Version of Leaflet
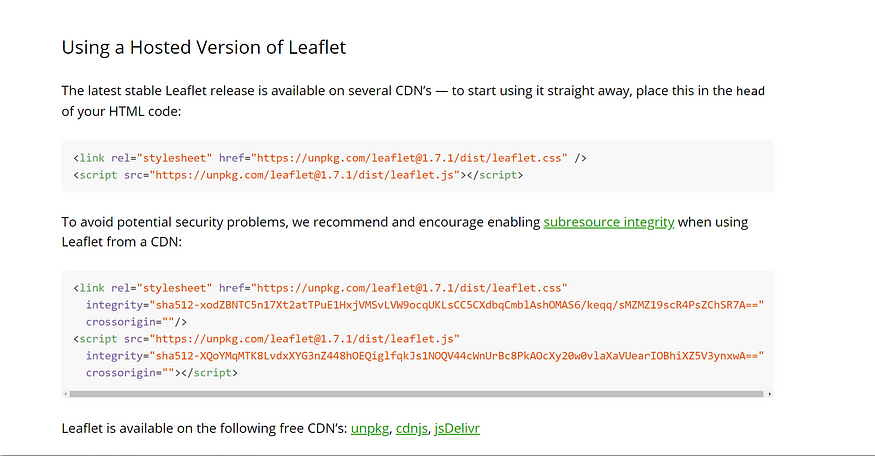
The easiest way to import and use leaflet in our application is to use the hosted version, so we will copy the url of the hosted leaflet libraries and paste it into our application code.
So firstly copy the first tag which contains the hosted leafelt.css file:
<link rel=”stylesheet” href=”https://unpkg.com/leaflet@1.7.1/dist/leaflet.css"
/>
Then paste this below the <title> tag of our application, like below:
<title>World Population Map</title>

<link rel=”stylesheet” href=”https://unpkg.com/leaflet@1.7.1/dist/leaflet.css"
/><style>
  h1 {
    color: red;
    font-style: italic;
  }
</style>
We can remove the code inside the <style> tags, that we previously used to style the heading. We will be adding the style for our map later.
Next we will copy the <script> tag, which contains the hosted leaflet.js file:
<script src="https://unpkg.com/leaflet@1.7.1/dist/leaflet.js"></script>
and paste it inside our <body> tag, like below:
<body>
  <script src="https://unpkg.com/leaflet@1.7.1/dist/leaflet.js"></script>
</body>
We can remove the <h1>HEADING\</h1> code from our body tags.
Now we have imported the leaflet.js library into our application, so now our html code should look as follows:
<!DOCTYPE html>
<html>
  <head>
    <meta charset="utf-8" />
    <!-- Tell the browser to be responsive to screen width -->
    <meta
      content="”width"
      ="device-width,"
      initial-scale="1,"
      maximum-
      scale="1,"
      user-scalable="no”"
      name="”viewport”"
    />
    <meta http-equiv="”x-ua-compatible”" content="”ie" ="edge”" />

    <title>World Population Map</title>

    <link rel=”stylesheet”
    href=”https://unpkg.com/leaflet@1.7.1/dist/leaflet.css" />
    <style></style>
  </head>
  <body>
    <script src="https://unpkg.com/leaflet@1.7.1/dist/leaflet.js"></script>
  </body>
</html>
Step 7: Creating our first map
We are now going to create our map using leaflet.js code.
The first thing we need to do is create a <div> element for our map, and add it above the <script> tag inside our <body> tag, like below:
<body>
  <div id="map"></div>
  <script src="https://unpkg.com/leaflet@1.7.1/dist/leaflet.js"></script>
</body>
We will add an id to the tag and call it ‘map’. We will use this id to style our map and to write the code for our map in leaflet.js.
Next we need to create an empty <script> tag below the leaflet.js library <script> tag like below:
<script src="https://unpkg.com/leaflet@1.7.1/dist/leaflet.js"></script>
<script></script>
We will be adding our leaflet.js code inside our empty <script> tags. This needs to be below the library tag, because we first need to load the leaflet.js library code, before we can use it to write our own map code.
Next we need to add a style for our map inside our <style> tag above. We need to set the height of our map and allow the entire map view to be visible on our screen, without needing to do any scrolling. So add the below style inside our style tags:
<style>
  #map {
    height: calc(100vh — 20px) !important;
  }
</style>
Next we need to add our basemap tile. We will be loading our basemap from a free web map service, that is hosted by ESRI. The tile that we will use as our basemap is called ‘World_Street_Map.
In our <script> tag, let’s add the code to import our tile from the web map service and store it in a variable as below:
    var world_street_map =
     L.tileLayer('http://services.arcgisonline.com/arcgis/rest/services/
     World_Street_Map/MapServer/tile/{z}/{y}/{x}'), {
       attribution: ‘Tiles © Esri — Source: Esri, DeLorme,
       NAVTEQ, USGS, Intermap, iPC, NRCAN, Esri Japan, METI, Esri China
      (Hong Kong), Esri (Thailand), TomTom, 2012’
    });
The tile is free to import, but we do need to give attribution to ESRI.
Next we will add the code to initialize our map by setting it’s properties and adding our basemap like below:
// Initialize the map
var map = L.map("map", {
  layers: [world_street_map], // Default basemap
}).setView([8.7832, 34.5085], 3);
Our maps will be added as layers, so right now we only have one layer and that is our basemap. We have also set the default latitude and longitude coordinates where we want the map view to point at, and next to it we set the default zoom level which is 3. All of these can be adjusted to suit your needs, feel free to play with it.
So now we have imported our basemap, then displayed it in our map view, and set the default properties for our map. We will now run our application and hope that our lealfet.js library has been imported successfully and our map has been created successfully as well.
Our full map.html code should now look as follows:
<!DOCTYPE html>
<html>
<head>
<meta charset=”utf-8"> <!-- Tell the browser to be responsive to screen width -->
<meta content=”width=device-width, initial-scale=1, maximum-
scale=1, user-scalable=no” name=”viewport”> <meta http-equiv=”x-ua-compatible” content=”ie=edge”>
<title>World Population Map</title>
<link rel=”stylesheet”
href=”https://unpkg.com/leaflet@1.7.1/dist/leaflet.css" />
<style>
#map {
height: calc(100vh — 20px) !important;
}
</style>
</head>
<body>
<div id=”map”></div>
<script src=”https://unpkg.com/leaflet@1.7.1/dist/leaflet.js">
</script>
<script>
var world_street_map = L.tileLayer(‘http://services.arcgisonline.com/arcgis/rest/services/World_Street_Map/MapServer/tile/{z}/{y}/{x}', {
attribution: ‘Tiles © Esri — Source: Esri, DeLorme, NAVTEQ, USGS, Intermap, iPC, NRCAN, Esri Japan, METI, Esri China (Hong Kong), Esri (Thailand), TomTom, 2012’
});
// Initialize the map
var map = L.map(‘map’, {
layers: [world_street_map] // Default basemap
}).setView([8.7832, 34.5085], 3)
</script>
</body>
</html>
Now we can save our map.html file and run our server. We should now be able to see our map visible in our web browser as seen below:
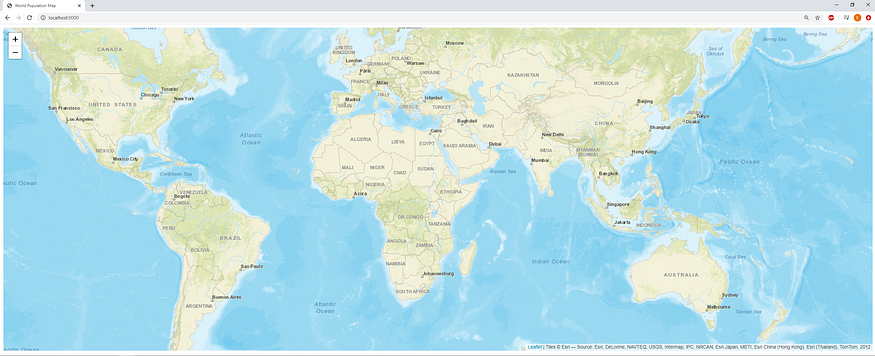
So now we have successfully loaded the basemap for our application, and we are now ready to add data to our map application. Feel free to play around with the map.
Step 8: Adding data markers to our map
Right now we only have a basemap and we need to ultimately display data on our map to make it meaningful and useful. So the next thing that we will do is add data in the form of markers.
The data that we will add is that of the World Population for the year 2015. Each country in our dataset will have a unique location and that will be plotted as a marker on our map.
So now let’s download our dataset from the link below:
https://raw.githubusercontent.com/EBISYS/WaterWatch/master/world_population_2015.geojson
Right click and save the file in the same directory as the rest of our project files. Remember to remove the .txt extension from the filename if it appears.
As you can see the data is stored in a .geojson file, so basically this is a special type of json file, and we need to use an external leaflet plugin to be able to read it. The plugin we will be using is called leaflet-ajax. The latest version seems to be 2.1.0 at this time. This can be found on the cdnjs website, however the url will be provided in this tutorial.
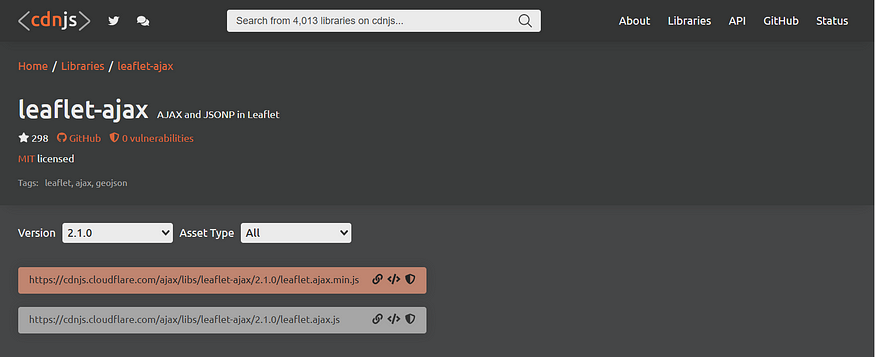
Here is the script url that we will use to import leaflet-ajax into our application:
<script src=”https://cdnjs.cloudflare.com/ajax/libs/leaflet-ajax/2.1.0/leaflet.ajax.min.js" integrity="sha512-Abr21JO2YqcJ03XGZRPuZSWKBhJpUAR6+2wH5zBeO4wAw4oksr8PRdF+BKIRsxvCdq+Mv4670rZ+dLnIyabbGw==" crossorigin=”anonymous”></script>
So let’s modify our map.html file and copy the above script tag and paste it below the leaflet.js script tag like below:
<script src="https://unpkg.com/leaflet@1.7.1/dist/leaflet.js"></script>
<script
  src="https://cdnjs.cloudflare.com/ajax/libs/leaflet-ajax/2.1.0/leaflet.ajax.min.js"
  integrity="sha512-Abr21JO2YqcJ03XGZRPuZSWKBhJpUAR6+2wH5zBeO4wAw4oksr8PRdF+BKIRsxvCdq+Mv4670rZ+dLnIyabbGw="
  crossorigin="”anonymous”"
></script>
So let us use this library to read our world population data and plot the data on our map in the form of markers.
Add the following code below the map initialization code:
  var geojsonLayer = new L.GeoJSON.AJAX(“world_population_2015.geojson”);
  geojsonLayer.addTo(map);
So here we read our geojson file using leaflet-ajax’s GeoJSON.AJAX object. This allows us to read geojson type data and then plot it on our map. All of this is handled by the leaflet library.
Save the map.html after adding the code above. Now we should be able to see our data plotted as markers on our map. First run the server.py code. And then open the localhost:8000 url in our browser if you haven’t already:
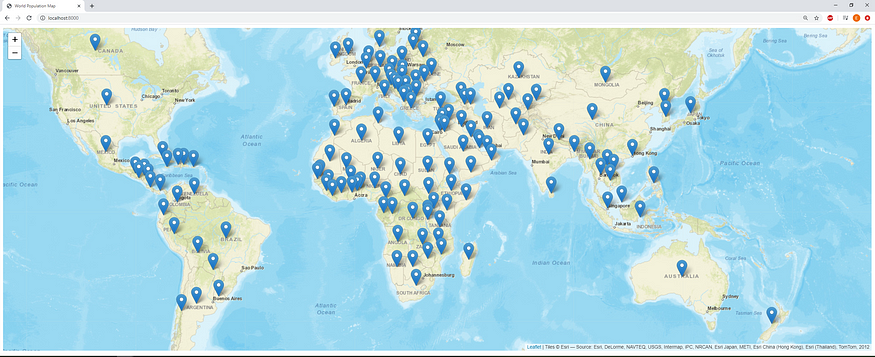
Feel free to play around with the map.
Step 9: Adding point markers to our map
Adding markers as a first step in building a map application is always useful for testing your ability to read data and plot it on the map. But it doesn’t give us much information. To expand the usefulness of our map we will be plotting the data as point markers.
So the first thing that we need to do, is to comment out the code for adding our markers like below, because we will replace it with the code for adding point markers.
    // var geojsonLayer = new
      L.GeoJSON.AJAX(“world_population_2015.geojson”); // geojsonLayer.addTo(map);
Now replace the code with the following:
    var geojsonLayer = new
      L.GeoJSON.AJAX(“world_population_2015.geojson”, {
        pointToLayer: function (feature, latlng) {
          return L.circleMarker(latlng, { });
        }
    }).addTo(map);
Now save your map.html file and re-run the server. Now we should be able to see our point markers plotted on our map:
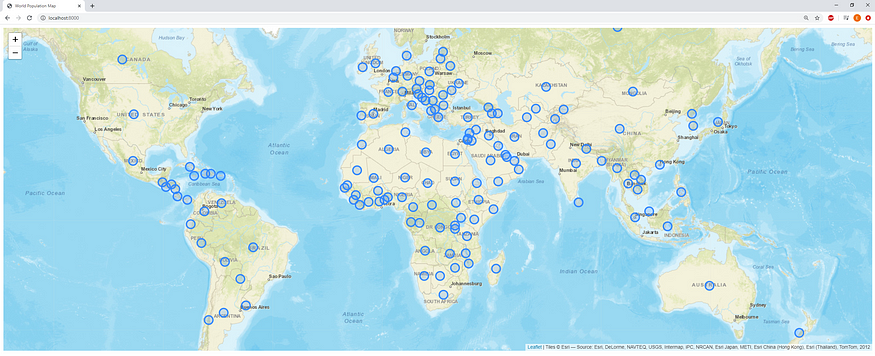
Now that we have plotted our data as points on the map, we can now begin with the fun stuff, which is styling our point markers.
Step 10: Styling our point markers
We have changed our markers to point markers, but we still cannot make much sense of the map as it stands. So we will be styling the point markers to represent the data more clearly, and to make the map more visually appealing and most importantly more useful.
We want to change the size of the circles to represent the size of the population for that specific location on the map. Once we achieve this we will be able to distinguish which countries have the biggest or smallest population of people, by simply looking at the map. This should be simple enough for even non-technical individuals to understand, and that is the ultimate goal of information.
Now inside the L.circleMarker() function, we will add the code for styling our circle markers as seen below:
    var geojsonLayer = new
        L.GeoJSON.AJAX(“world_population_2015.geojson”, {
          pointToLayer: function (feature, latlng) {
            return L.circleMarker(latlng, {
              // Stroke properties
              color: ‘#cc0000’,
              opacity: 0.75,
              weight: 1, // Fill properties
              fillColor: ‘#cc0000’,
              fillOpacity: 0.6,
              radius: feature.properties.pop_2015 / 7000000 });
          }
    }).addTo(map);
So here the styling is pretty simple, the only property that needs explaining might be the radius, this property sets the size of our circle markers. We are telling it to use the size of the population as the size of the circle marker. That way we will have different circle sizes for different population numbers. This will help us visually distinguish countries with a large or small population of people. For example China and India, should have the biggest populations, and therefore the circle markers on our map for China and India will have the biggest sizes, this will not be hard to see. Then we divide the population count value by a large number, because the population count is a very big number and a circle with that radius will fit the whole screen and mess up the map. So by dividing the population count value by a large number, we allow the circle to fit properly on our map.
Once you have added the styling code, save the map.html file and re-load the server. You should now see our final map displayed as below:
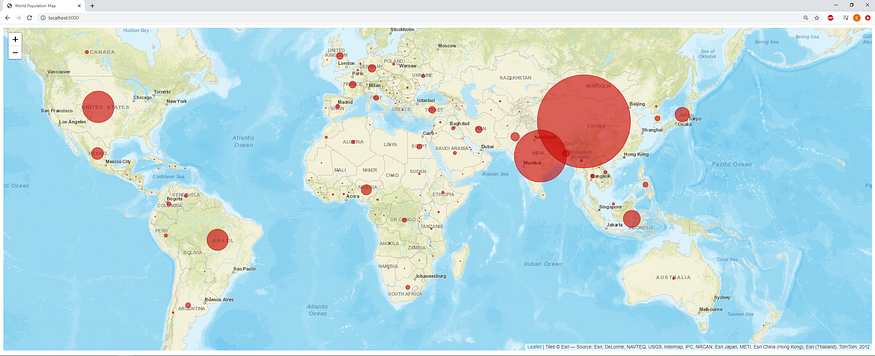
So now we can see that our map is much more useful, and is simple enough for us to understand what it’s trying to portray. As you can see the size of the circle scales to the size of the population and by inspection we can see that China has the largest population of people on earth.
Your map.html file code should now look like the following:
<!DOCTYPE html>
<html>
<head>
<meta charset="utf-8" />
<!-- Tell the browser to be responsive to screen width -->
<meta
content="width=device-width, initial-
scale=1,maximumscale=1, user-scalable=no"
name="viewport"
/>
<meta http-equiv="x-ua-compatible" content="ie=edge" />
<title>World Population Map</title>
<link
rel="stylesheet"
href="https://unpkg.com/leaflet@1.7.1/dist/leaflet.css"
/>
<style>
#map {
height: calc(100vh - 20px) !important;
}
</style>
</head>
<body>
<div id="map"></div>
<script src="https://unpkg.com/leaflet@1.7.1/dist/leaflet.js"></script>
<!-- Download leaflet.ajax plugin from
https://cdnjs.com/libraries/leaflet-ajax -->
<script
src="https://cdnjs.cloudflare.com/ajax/libs/leaflet- ajax/2.1.0/leaflet.ajax.min.js"
integrity="sha512-Abr21JO2YqcJ03XGZRPuZSWKBhJpUAR6+2wH5zBeO4wAw4oksr8PRdF+BKIRsxvCdq+Mv4670rZ+dLnIyabbGw=="
crossorigin="anonymous"
></script>
<script>
var world_street_map = L.tileLayer(
"http://services.arcgisonline.com/arcgis/rest/services/W orld_Street_Map/MapServer/tile/{z}/{y}/{x}",
{
attribution:
"Tiles © Esri — Source: Esri, DeLorme, NAVTEQ, USGS, Intermap, iPC, NRCAN, Esri Japan, METI, Esri China (Hong Kong), Esri (Thailand), TomTom, 2012",
}
); // Initialize the map
var map = L.map("map", {
layers: [world_street_map], // Default basemap
}).setView([8.7832, 34.5085], 3); // Plot markers // var geojsonLayer = new
L.GeoJSON.AJAX("world_population_2015.geojson");
// geojsonLayer.addTo(map); // Plot circle markers
var geojsonLayer = new L.GeoJSON.AJAX("world_population_2015.geojson", {
pointToLayer: function (feature, latlng) {
console.log(feature.properties);
return L.circleMarker(latlng, {
// Stroke properties
color: "#cc0000",
opacity: 0.75,
weight: 1, // Fill properties
fillColor: "#cc0000",
fillOpacity: 0.6,
radius: feature.properties.pop_2015 / 7000000,
});
},
}).addTo(map);
</script>
</body>
</html>
Your server.py file code should now look like the following:
    import http.server
    import socketserverclass RequestsHandler(http.server.SimpleHTTPRequestHandler):
      """
      Handles http requests
      """
      def do_GET(self):
        if self.path == '/':
          self.path = 'map.html'
        return http.server.SimpleHTTPRequestHandler.do_GET(self)# Create object of above class
    handler_object = RequestsHandlerPORT = 8000
    my_server = socketserver.TCPServer(("", PORT), handler_object)# Start the server
    print("Server started at localhost:" + str(PORT))
    my_server.serve_forever()
Feel free to play around with the map application. There is so much more that you can do to add even more information to the map, for instance legends, popup texts to portray the actual population value by clicking on a circle marker. You can even add different types of base maps and toggle between them.
That’s it for this tutorial, I hope you have enjoyed it.
Comments
Loading comments…