Perhaps we can all relate to a landmark moment in our data science careers when we’ve had to spend a good portion of a day generating a multitude of repetitive and tedious reports that could have otherwise been generated automatically. It goes without saying that your time is far more valuable than having to attend to the pesky undertaking of filling in tables, and writing headers, sub-headers, and figure numbers. Savor the moment by doing something ever so slightly more purposeful, like reading up on TDS or checking out the latest frameworks available for server-less computing. Literally anything but filling in those pesky rows and columns.
Python-docx
Luckily there’s a package to remedy our predicament — python-docx. If you haven’t already perused their documentation, then I highly advise you to do so. It is quite possibly one of the most intuitive and self-explanatory APIs I have worked with in recent times. It allows you to automate document generation by inserting text, filling in tables, and rendering images into your report on demand. Without further ado, let’s go ahead and generate an automated report of our own!
Creating a Template
Before you can proceed, you must first create your very own template document that is basically a normal Microsoft Word Document (.docx) formulated exactly the way you want your automated report to be, down to every nitty-gritty detail such as typefaces, font sizes, formatting, and page structure. The only thing you need to do afterward is to create placeholders for your automated content and declare them with variable names as shown below.
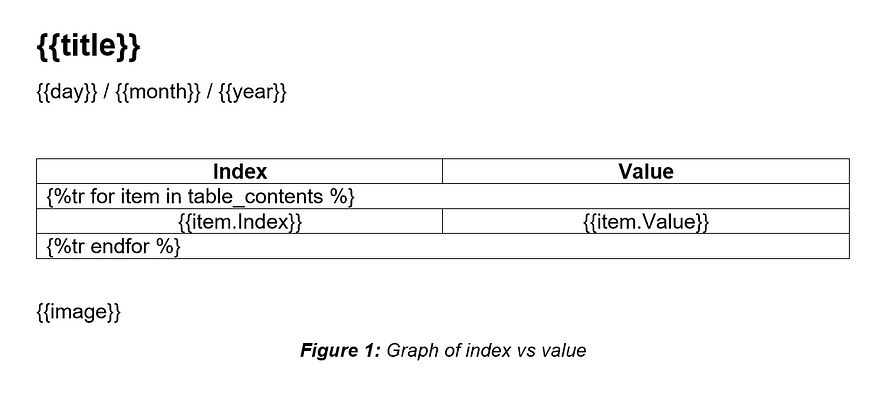
As you’ve probably promptly guessed, any automated content can be declared inside a set of double curly brackets {{variable_name}}. This includes text and images. For tables, it is a little more complicated. You need to create a table with a template row with all the columns included, and then you need to append one row above and one row below with the following notation:
First row:
{%tr for item in _variable_name_ %}
Last row:
{%tr endfor %}
Please note that in the figure above the variable names are
- table_contents for the Python dictionary that will store our tabular data
- Index for the dictionary keys (first column)
- Value for the dictionary values (second column)
Once done, save your document in your directory as a .docx file and proceed with writing the code to invoke the template and generate an automated document.
Source Code
Now that you’ve created your template, fire up Anaconda or any Python IDE of your choice and install the following packages:
pip install docx
pip install docxtpl
Then start a new script and import all the required packages:
from docx.shared import Cm

from docxtpl import DocxTemplate, InlineImage

from docx.shared import Cm, Inches, Mm, Emu

import random

import datetime

import matplotlib.pyplot as plt
Subsequently, import your created template and instantiate your variables:
#Import template document

template = DocxTemplate('automated_report_template.docx')

#Generate list of random values

table_contents = []

x = []

y = []

for i in range(0,12):

number = round(random.random(),3)

table_contents.append({

'Index': i,

'Value': number

})

x.append(i)

y.append(number)

#Plot random values and save figure

fig = plt.figure()

plt.plot(x, y)

fig.savefig('image.png', dpi=fig.dpi)

#Import saved figure

image = InlineImage(template,'image.png',Cm(10))
Finally, declare your variables in a dictionary and use it to render your automated word document:
#Declare template variables

context = {

'title': 'Automated Report',

'day': datetime.datetime.now().strftime('%d'),

'month': datetime.datetime.now().strftime('%b'),

'year': datetime.datetime.now().strftime('%Y'),

'table_contents': table_contents,

'image': image

}

#Render automated report

template.render(context)

template.save('generated_report.docx')
Results
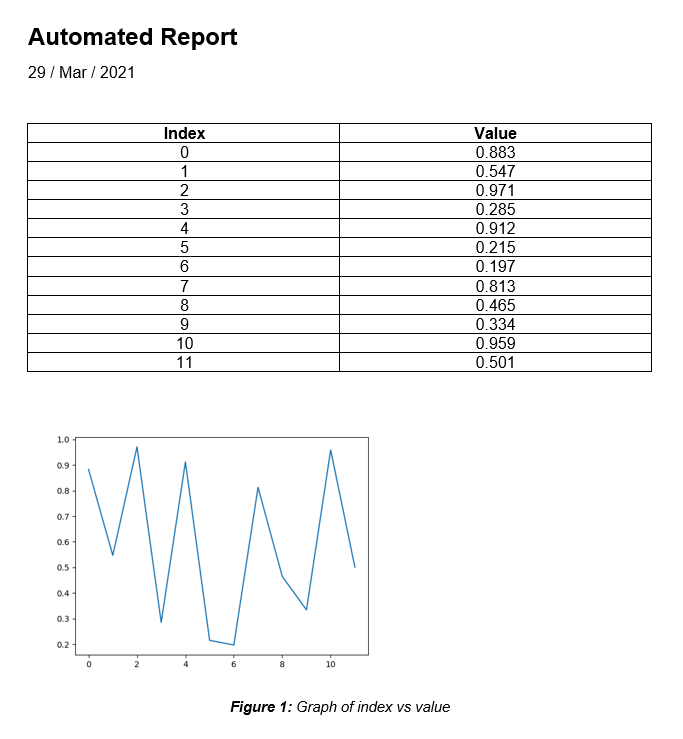
And there you have it, your automatically-generated report in short order! And in case you’re wondering, yes you can generate as many rows and columns as you want in your table and can also render as many pages as needed in your document.
If you want to learn more about data visualization and Python, then feel free to check out the following (affiliate linked) courses:
GitHub repository:
☕ Liked this tutorial? Feel free to donate a coffee to me here.
Comments
Loading comments…