Introduction
Living in the information age, we use - and generate - massive amounts of data every single day, and the need to visualize and meaningfully interpret this data is becoming increasingly critical. Everything from marketing, to finance, to internal analytics, to human resources is data-driven these days.
So how could we represent all this data in a form that humans can understand quickly and intuitively? After all, we can no longer rely on non-interactive and bulky bitmap charts stored on servers; the sheer amount of data and the speed with which they need to be served are too much for that. Nor can we rely on plugins like Flash or Silverlight, because mobile device usage has skyrocketed and they would quickly chew through batteries and data limits.
The need right now is for client-side technologies that can run quickly, efficiently, and render large amounts of data responsively at ultra-high resolutions, on any platform and browser.
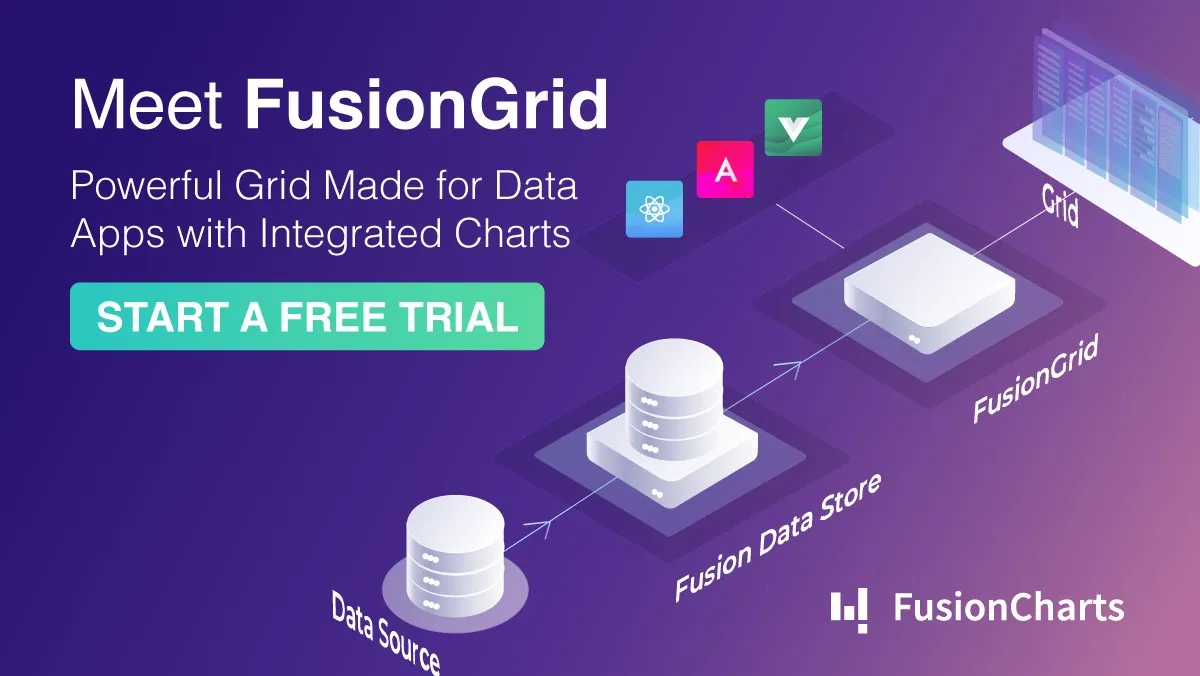
Meet FusionGrid, the latest offering from FusionCharts. A JavaScript-based data-grid component, it is the answer for beautiful, fast, responsive - and most importantly - highly customizable grids and data tables in JavaScript, that render well across all modern browsers, platforms, and devices.
What you can do with FusionGrid
1. Create Beautiful, Responsive, Mobile-friendly Grid Visualizations
Your data is only as good as its representation. How people read - and interact - with your data, is equally important as the work you've put into analyzing it. The mobile device boom in the last decade has been a complete game-changer. And with so many varieties of devices in the palms of people worldwide, how are you going to reach them with data that's detailed and easy-to-follow... but also visually appealing and adaptable?
FusionGrid is the no-compromise solution you want to craft the exact data visualization experience you have in mind. Built from the ground up with a responsiveness-first mindset, it ensures a consistent user experience across all devices and platforms. It provides beautiful grid customization with out-of-the-box features like Column Filter, Data Export, Row Selection, Column Grouping, Real-time Data Update, Row Sorting, and Search/Quick Filter, user-friendly UI/UX design, and animations for every data operation to enhance user experience. FusionGrid is also lightweight and efficient - because mobile-friendliness is about more than just looks.
2. High-performance Big Data Renders
Real-world data is a completely different beast from the curated datasets that you see on product preview pages. Often, you'll need to render data with millions of data points, and you'll want to do it without performance issues, and without reinventing the wheel as a developer.
At FusionCharts, we believe that visualization of Big Data doesn't have to be difficult. With FusionGrid, we've created a suite of components that are specifically optimized for working with very large datasets and designed for high-performance computing. All so you can ensure fast, stable displays of big data without losing interactivity, or overloading the browser.
3. Real-Time Data Visualization
FusionGrid is capable of handling large volumes of data with very short update and refresh cycles. It will automatically update the grid in your applications whenever data is updated, without needing third-party libraries.
This makes FusionGrid ideal for use-cases that need real-time, responsive data visualizations, and are always being monitored by organizations based on their internal metrics.
4. Filter, Sort, and Search
Navigating through data and extracting relevant information is the first step towards making any kind of meaningful analysis, and FusionGrid places powerful tools at your disposal to make this process effortless. Filter, Sort & Search data on any relevant column on the grid, so you can find the data that you need quickly, easily, and intuitively.
5. Fast, Flexible Selection
Faster retrieval of large volumes of data means faster processing and faster analysis. To enable this, FusionGrid comes with a robust, consistent Selection API, providing users multiple options to select rows and cells quickly. The API provides enough flexibility here to fit every use-case, whether you need low-level, granular control, or need to abstract details to get the job done quickly.
6. Pagination
Loading the entirety of a large dataset into the browser at once is neither useful nor efficient, but handing out data in pieces by forcing the user to interrupt their workflow and reload the page, or navigate to a new page, is not a good design either.
That's why pagination is probably the most important aspect of data visualization, and FusionGrid makes this fast, efficient, and customizable when working with large data sets. You have full control over every aspect of pagination with a few flags, from controlling the page size to the appearance of breadcrumbs.
7. Dashboards
You no longer need to search outside of the FusionCharts product portfolio for a suitable grid solution with the launch of FusionGrid. FusionGrid is designed to work with the same datastore as FusionCharts, making it a perfect complement to your dashboard needs.
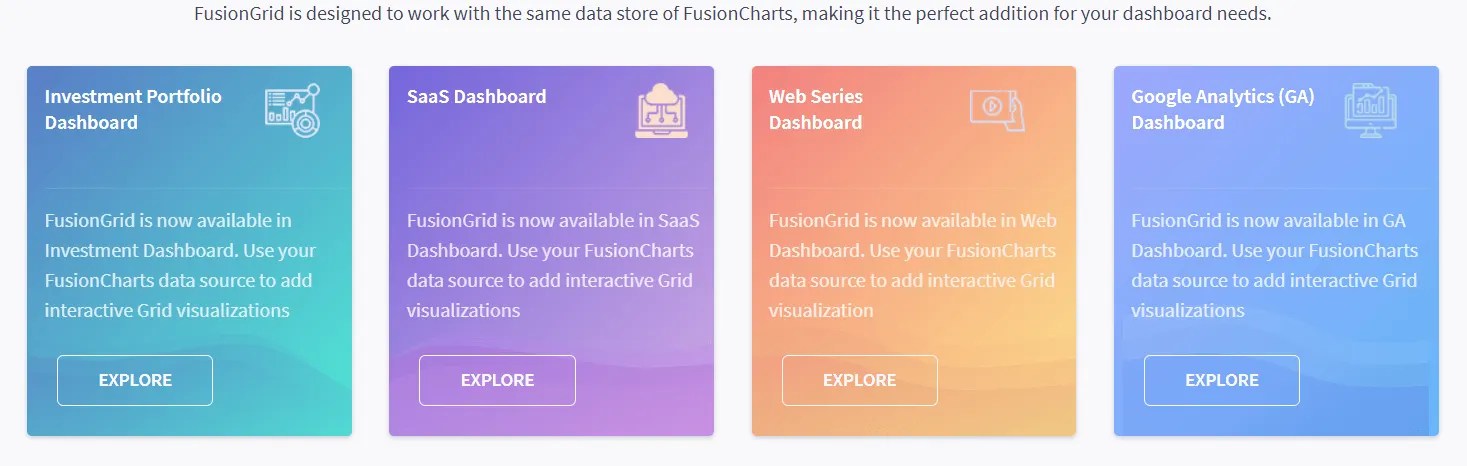
Investment Portfolio | SaaS Dashboard | Web Series Dashboard | Google Analytics
8. Built-in Exports (CSV, JSON & XLS)
Business dashboards are the industry-standard way of representing data in a way that's both beautiful and insightful. Having the ability to export and share this data is a no-brainer for any organization. After all, these metrics are going to be used for making strategic decisions that will shape the future of the organization for years to come.
This is an ideal use-case for FusionGrid, and it comes with out-of-the-box functionality for both client and server-side exports, with little-to-no coding. Export data in CSV, JSON, and XLS (Excel) formats, based on your choice and your audience.
9. Easy Integration
A data visualization library is only as good as its ease of integration with existing applications. According to StackOverflow's 2021 Developer Survey, React, Angular, and Vue.js are the most popular JavaScript front-end frameworks, coming in at 40.14%, 22.96%, and 18.97% respectively. FusionGrid can be integrated smoothly into all of these, or if you so prefer, it can also be included in the web page itself, served via CDN.
Power at your fingertips
FusionGrid comes with many powerful features to help you present a data-rich, interactive, and responsive grid of data however you see fit.
Column Filters
- Let you specify values within a column, to find the data you need based on context.
- The grid is dynamically filtered in place. No page reloads or redirections.
Row Sorting
- Sort every column according to your needs with a simple click, to quickly find relevant data.
- Use predefined sorts, or define your own sorting method for full customization.
Row Selection
- Flexible row selection to fit your needs. Select and deselect single or multiple rows, with or without checkboxes...
- ...or define custom selection methods entirely, if you so desire.
- This flexibility makes it quick and painless to select exactly the rows you want to perform secondary actions on the page like content update, fetching data, etc.
Search/Quick Filters
- Enables you to search the entire visible grid for relevant information, across all columns, and then filter the entire selection.
- Custom search methods can also be defined for more fine-grained control.
Column Grouping/Nested Columns
- Columns can be grouped into categories for better organization, a better user experience, and better context for the presented data.
Row Animation upon Data Operation Interaction
- Built-in animations for each data operation (sort, search, filter, etc.), enhancing user experience.
- Animations are consistent across all devices and platforms.
Data Export
- A single line of code enables quick and easy export of data in CSV, JSON, or XLS (Excel) formats based on your choice.
- Out-of-the-box functionality provided by FusionGrid, no need to code this from scratch. Free up development time for things that actually need it.
Technology Stack Integration
We currently provide official components that provide FusionGrid binding in the three most popular front-end JavaScript frameworks: React, Angular, and Vue.js. These components are simple, lightweight, easily installed via npm, and easily integrated into your existing web applications.
We also have extensive tutorials, documentation, code snippets, and demos for each plugin, to help you save time and build the perfect dashboard you need for your project. If you need further help, reach out to our Live Support teams and they'll respond in minutes to solve your issues.
Compatibility
FusionGrid is compatible with all modern browsers, across desktops, tablets, and mobile devices as listed below:
Internet Explorer: 11.0+
Firefox: 26.0+
Chrome: 31.0+
Safari: 7.0+
Opera: 18.0+
iOS (Safari): 7.1+
Android Browser: 4.4+
Conclusion
Plenty of chart, grid, and dashboard libraries are available today to meet a variety of needs and use-cases, but the difference between handpicked data sets and real-world data is night and day. And the difference between that and massive, difficult-to-manage volumes of data that must be processed and represented on a daily basis is even greater.
This is where FusionGrid comes in making it quick, easy, and painless to structure and present this huge quantity of dynamic data in responsive grids and dashboards, across PCs, tablets, and mobile devices, to better empower enterprises to make strategic decisions.
Licensing, Pricing, and Free Trial
A fully-functional trial version of FusionGrid can be downloaded and evaluated for free. The only restriction of the trial version is that it includes a FusionGrid Trial watermark below each exported grid.
To remove this watermark, or to use FusionGrid for either production or commercial purposes, a license is required. FusionGrid is licensed separately from FusionCharts Suite (the JavaScript charting library). It can be licensed on a per-server basis, or based on a number of dashboards that you wish to export. Please contact our sales team to initiate a licensing discussion.
Comments
Loading comments…